
Image
|
Figure Caption
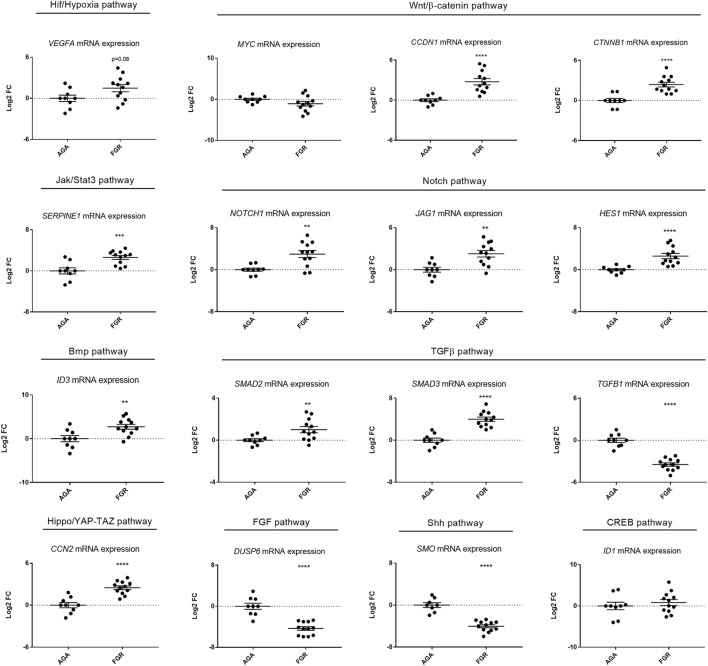
FIGURE 1
Signalling pathway dysregulation in human FGR samples. Quantitative RT-PCR analysis performed on umbilical cords from FGR cases and AGA controls, focusing on ten signalling pathways, identified significant upregulation in seven pathways (Hif/Hypoxia, Wnt/β-catenin, Jak/Stat3, Notch, Bmp, TGFβ, Hippo/YAP-TAZ), downregulation in two (FGF, Shh) and no modification in one (CREB). Sample size:
Acknowledgments
This image is the copyrighted work of the attributed author or publisher, and
ZFIN has permission only to display this image to its users.
Additional permissions should be obtained from the applicable author or publisher of the image.
Full text @ Front Cell Dev Biol