
IMAGE
Fig. 4
- ID
- ZDB-IMAGE-220831-26
- Publication
- Paul et al., 2022 - Aluminum (Al) causes a delayed suppression of nucleotide excision repair (NER) capacity in zebrafish (Danio rerio) embryos via disturbance of DNA lesion detection
- All Figures
- Figures for Paul et al., 2022
Image
|
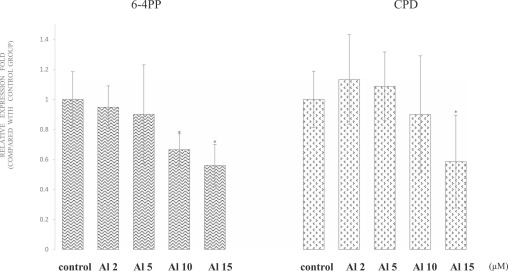
Figure Caption
Fig. 4 Fig. 4. Quantitative analysis of the effects of Al on CPD and 6–4PP sensing activities in zebrafish embryos. Each bar graph represents the mean and standard deviation of 4–6 independent experiments. * indicates p < 0.05 when compared to control.
Acknowledgments
This image is the copyrighted work of the attributed author or publisher, and
ZFIN has permission only to display this image to its users.
Additional permissions should be obtained from the applicable author or publisher of the image.
Full text @ Ecotoxicol. Environ. Saf.