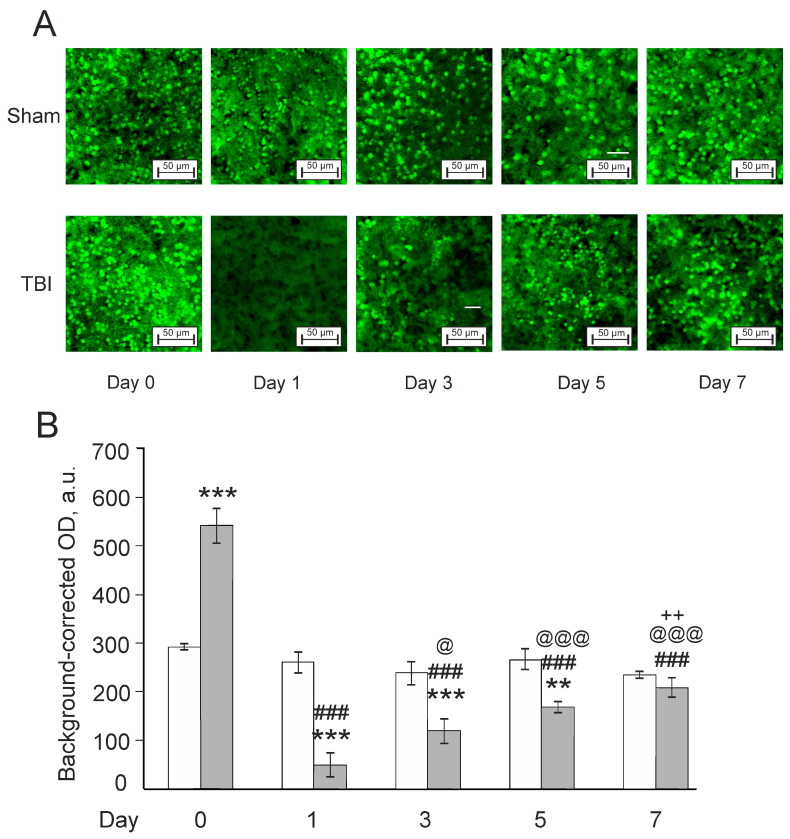
Fig. 7
Effects of laser-induced lesion (TBI model) on the expression of NeuN in the telencephalon on Day 0 (30 min after the lesion), Days 1, 3, 5, and 7 after the injury in zebrafish. (A): Representative images of NeuN immunoreactivity in the telencephalon; magnification, × 200. (B): Quantitative results. White bars represent the Sham groups; grey bars—TBI groups. The data are expressed as mean ± SEM (n = 3–4 per group). ** p < 0.01, *** p < 0.001 vs. Sham group on the same day after the injury; ### p < 0.001 vs. TBI group on Day 0; @ p < 0.05, @@@ p < 0.001 vs. TBI group on Day 1; ++ p < 0.01 vs. TBI group on Day 3.

