
IMAGE
Fig. 4
- ID
- ZDB-IMAGE-220829-53
- Publication
- Tikhonova et al., 2022 - A Novel Laser-Based Zebrafish Model for Studying Traumatic Brain Injury and Its Molecular Targets
- All Figures
- Figures for Tikhonova et al., 2022
Image
|
Figure Caption
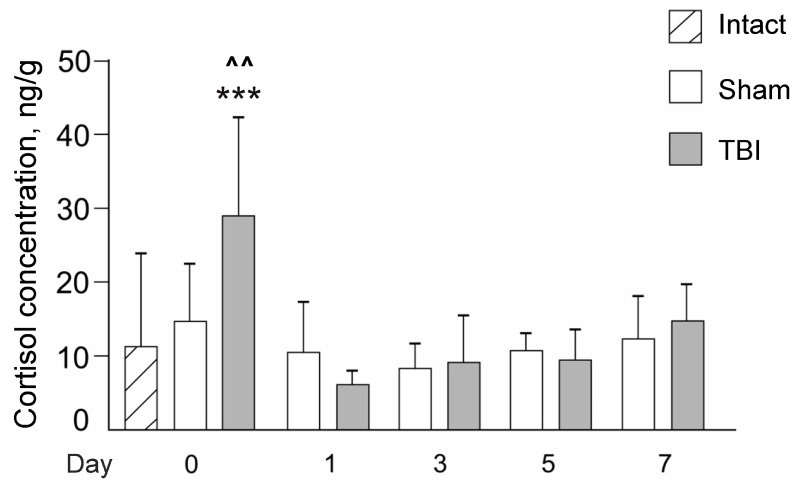
Fig. 4
Effects of the laser-induced lesion (TBI model) on zebrafish whole-body cortisol on Day 0 (30 min after the lesion), 1, 3, 5, and 7 days after the injury. White bars represent Sham groups, grey bars—TBI groups; hatched bar—intact zebrafish. Data are expressed as mean ± SEM. *** p < 0.001 vs. Sham group on Day 0; ^^ p < 0.01 vs. Intact zebrafish on Day 0.
Figure Data
Acknowledgments
This image is the copyrighted work of the attributed author or publisher, and
ZFIN has permission only to display this image to its users.
Additional permissions should be obtained from the applicable author or publisher of the image.
Full text @ Pharmaceutics