
|
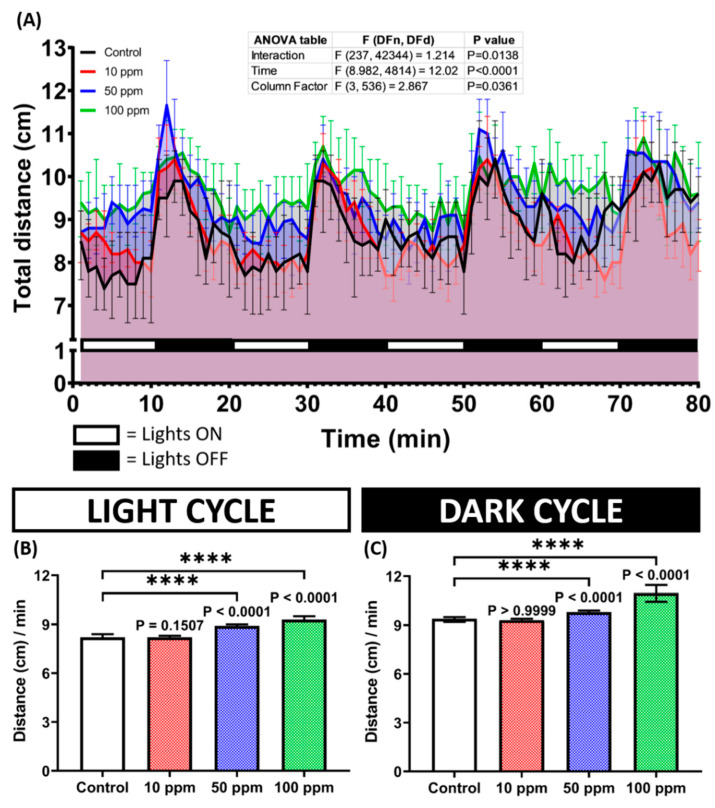
Fig. 5 (A) Total distance traveled per minute by 128 hpf zebrafish larvae after 1-day exposure of 0 (control), 10 ppm, 50 ppm, and 100 ppm of p-Toluene Sulfonamide (p-TSA) during both light and dark cycles. The data were analyzed by a two-way ANOVA test with Geisser-Greenhouse correction, continued with Dunnett’s multiple comparisons test. (B,C) Comparison of total distance traveled by the larvae in light and dark cycles, respectively. The data were analyzed using the Kruskal–Wallis test, followed by Dunn’s multiple comparisons test. All data are expressed in median with 95% CI (n = 135 for control and 10 ppm groups, n = 134 for 50 ppm group, n = 136 for 100 ppm group; **** p < 0.0001).