
Image
|
Figure Caption
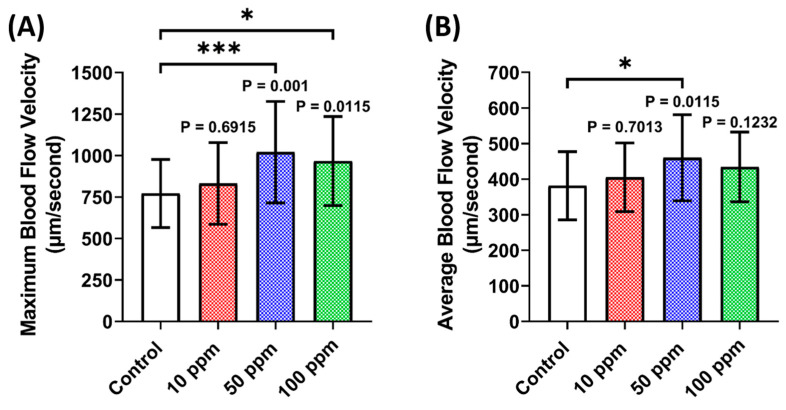
Fig. 4 Vascular performance parameter endpoints ((A) Maximum blood flow velocity and (B) average blood flow velocity) of zebrafish larvae after 24 h incubation in 10, 50, and 100 ppm of p-Toluene Sulfonamide (p-TSA). The statistical difference was calculated using Ordinary One-Way ANOVA with Dunnet multiple comparison test. The data are shown as mean with SD (n = 30, except 50 ppm group (n = 29); * p < 0.05, *** p < 0.001).
Acknowledgments
This image is the copyrighted work of the attributed author or publisher, and
ZFIN has permission only to display this image to its users.
Additional permissions should be obtained from the applicable author or publisher of the image.
Full text @ Biomolecules