
Image
|
Figure Caption
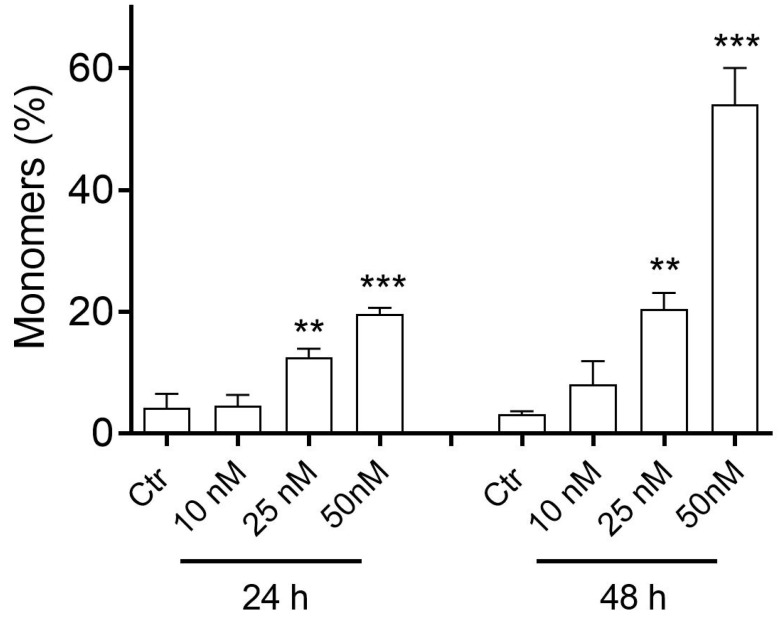
Fig. 6
Assessment of mitochondrial depolarization after treatment with 3d. HeLa cells were treated with the indicated concentrations of compound for 24 or 48 h. Data are represented as mean ± SEM of three independent experiments (** p < 0.01, *** p < 0.001).
Acknowledgments
This image is the copyrighted work of the attributed author or publisher, and
ZFIN has permission only to display this image to its users.
Additional permissions should be obtained from the applicable author or publisher of the image.
Full text @ Pharmaceuticals (Basel)