
Image
|
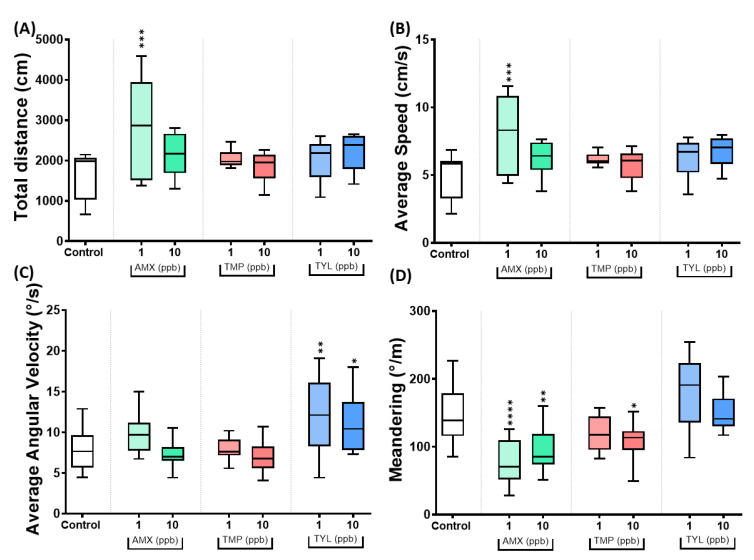
Figure Caption
Fig. 6
The locomotor activity endpoints of control and antibiotic-treated golden zebrafish after 10 days exposure. (A) Total distance traveled (cm); (B) average speed (cm/s); (C) average angular velocity (°/s); and (D) meandering movement (°/m). The data are expressed as mean ± S.E.M and were analyzed by ordinary one-way ANOVA followed by Dunnett’s test (n control: 12, n for antibiotic groups: 12, except n for AMX 1 ppb and TMP 10 ppb: 11, and n TYL 10 ppb: 10). The significances were indicated by * p < 0.05; ** p < 0.01, *** p < 0.001, and **** p < 0.0001 when compared to control group.
Acknowledgments
This image is the copyrighted work of the attributed author or publisher, and
ZFIN has permission only to display this image to its users.
Additional permissions should be obtained from the applicable author or publisher of the image.
Full text @ Antibiotics (Basel)