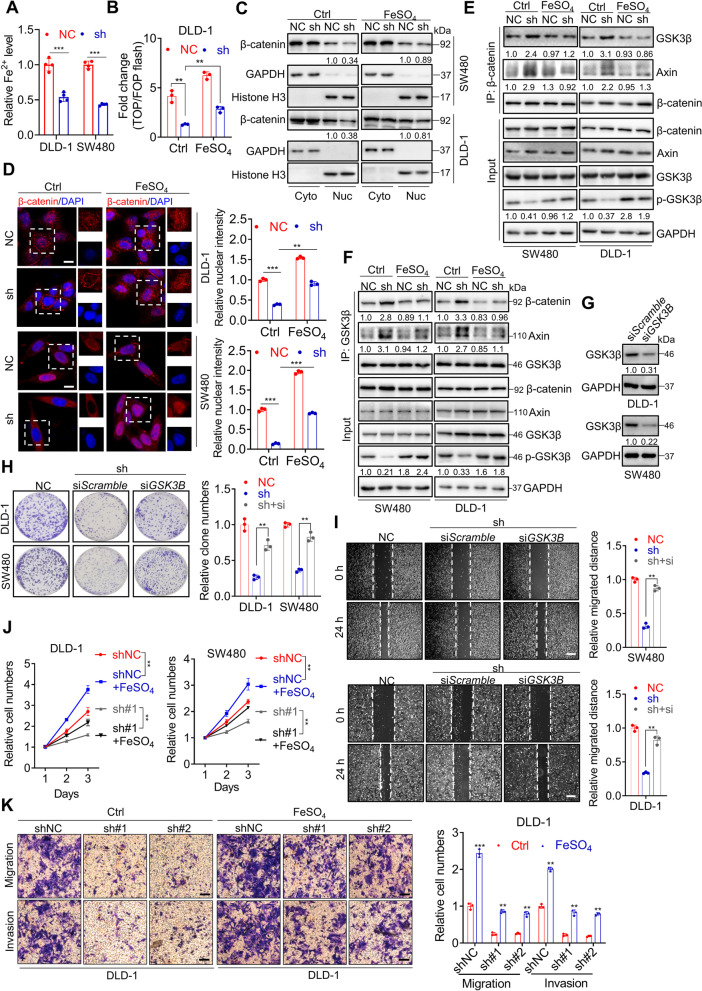
Fig. 7
STEAP3-AS1/STEAP3-mediated Fe2+ inactivates GSK3β to stimulate wnt/β-catenin signaling. A Relative cellular Fe2+ level in DLD-1 and SW480 cells with or without STEAP3-AS1 knockdown. B TOP/FOP flash assay for detecting the transcriptional activity of Wnt/β-catenin signaling in control or STEAP3-AS1 knockdown DLD-1 cells with or without FeSO4 (100 μM) treatment for 48 h. C After treatment with or without FeSO4 (100 μM) for 48 h, control or STEAP3-AS1 knockdown DLD-1 and SW480 cells were analyzed to show the subcellular distribution of β-catenin using nuclear/cytoplasmic fractionation and subsequent WB analysis. (Cyto, cytoplasm; Nuc, nucleus). D Control or STEAP3-AS1 knockdown DLD-1 and SW480 cells were seeded on slides on 24 well-plates overnight and treated as in (C), IF assay was conducted to detect the subcellular distribution of β-catenin. Scale bar: 10 μm. (E-F) Control or STEAP3-AS1 knockdown DLD-1 and SW480 cells were seeded on a culture dish overnight and treated as in (C). Immunoprecipitation (IP) and WB analysis were performed to observe the interaction between β-catenin and GSK3β. G The efficiency of siRNA-mediated GSK3β knockdown was measured by western blotting. H The colony formation of control and STEAP3-AS1 knockdown DLD-1 and SW480 cells treated with or without GSK3β siRNA. I Wound healing assay and relative migration distance of control and STEAP3-AS1-knockdown DLD-1 and SW480 cells treated with or without GSK3β siRNA. Scale bar: 100 μm. J Control or STEAP3-AS1 knockdown DLD-1 and SW480 cells were treated as in (C). Cell growth was performed by MTT assay over a 3-day period. (sh#1, shSTEAP3-AS1 #1). K Control or STEAP3-AS1 knockdown DLD-1 cells were treated as in (C). Migration and invasion of DLD-1 cells were evaluated by transwell assays. Scale bar: 100 μm. (sh#1, shSTEAP3-AS1 #1; sh#2, shSTEAP3-AS1 #2). Data are means ± s.d. and are representative of at least 3 independent experiments. (** P < 0.01 and *** P < 0.001)

