Fig. 2
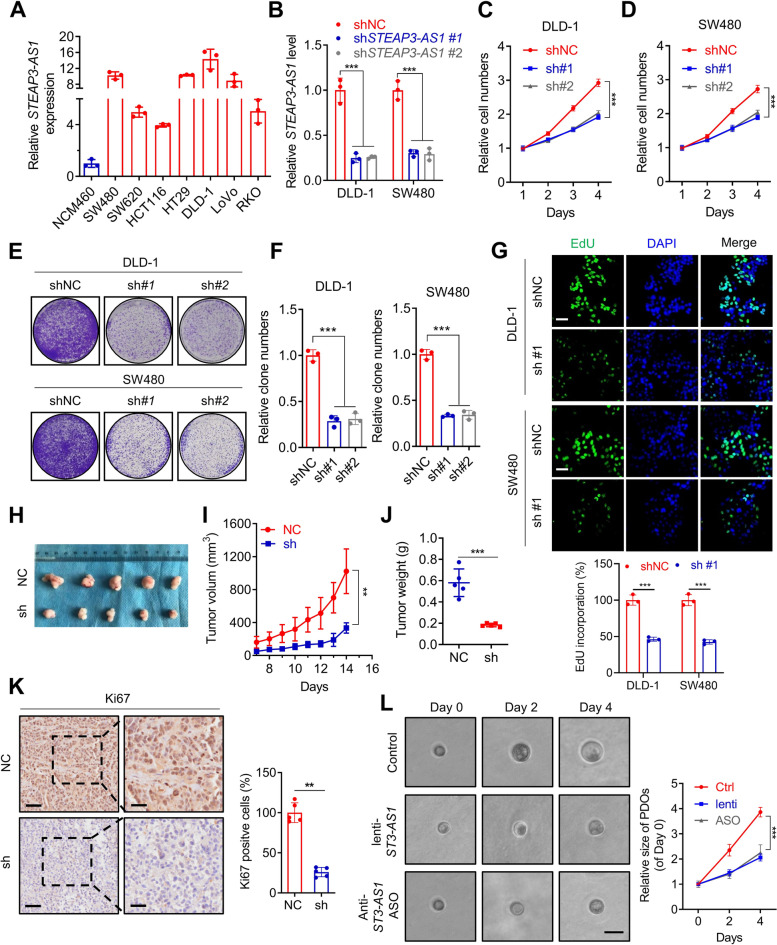
LncRNA STEAP3-AS1 promotes growth of CRC cells both in vitro and in vivo. A Basal level of STEAP3-AS1 was determined using qPCR assay in the nonmalignant human colon epithelial cell line NCM460 and several CRC cell lines (including SW480, SW620, HCT116, HT29, DLD-1, LoVo, and RKO). B qPCR analysis was performed to detect the RNA levels of STEAP3-AS1 in DLD-1 and SW480 cells with or without STEAP3-AS1 stable knock-down. C-D The growth of DLD-1 (C) and SW480 (D) cells was monitored by MTT assay over a 4-day period with or without STEAP3-AS1 knockdown. (sh#1, shSTEAP3-AS1 #1; sh#2, shSTEAP3-AS1 #2). E The effects of lncRNA STEAP3-AS1 knockdown on the proliferation of SW480 and DLD-1 cells were examined by colony formation assays. Top, DLD-1 cells; bottom, SW480 cells. (sh#1, shSTEAP3-AS1 #1; sh#2, shSTEAP3-AS1 #2). F Relative clone numbers in (E). Left, DLD-1 cells; right, SW480 cells. (sh#1, shSTEAP3-AS1 #1; sh#2, shSTEAP3-AS1 #2). G EdU assays were used to detect the proliferation rate of SW480 (bottom) and DLD-1 (top) cells with or without STEAP3-AS1 knockdown. Scale bar: 50 μm. (sh#1, shSTEAP3-AS1 #1). H Images of isolated tumors from the subcutaneous tumor mice model established using DLD-1 cells with or without STEAP3-AS1 knockdown. I-J Tumor volume (I) and weight (J) were significantly decreased in the lncRNA STEAP3-AS1 knockdown group compared with the control group. K Left, representative images of Ki67 staining of the tumor tissue; right, the statistic graph of Ki67 positive cells. Scale bar: left 50 μm, right 20 μm. L Left, brightfield images of organoids treated with lenti-shSTEAP3-AS1 or anti-STEAP3-AS1 ASO for indicated times; right, the statistic graph of relative size of PDOs. scale bar: 100 μm. Data are means ± s.d. and are representative of at least 3 independent experiments. (** P < 0.01 and *** P < 0.001)

