
Fig. 3
- ID
- ZDB-IMAGE-220824-4
- Genes
- Publication
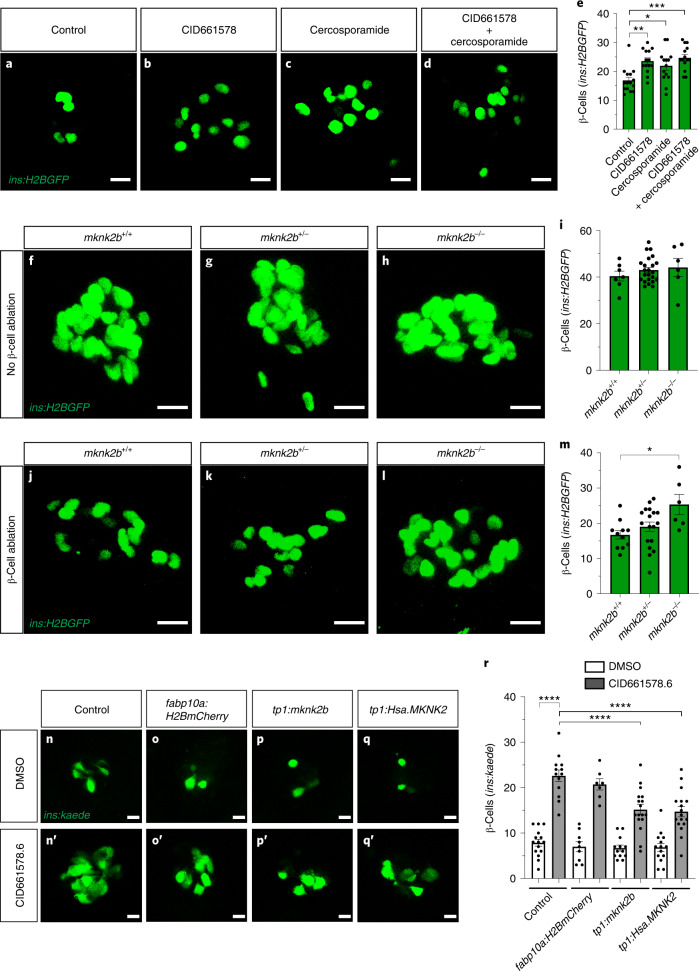
- Karampelias et al., 2022 - MNK2 deficiency potentiates β-cell regeneration via translational regulation
- All Figures
- Figures for Karampelias et al., 2022
|
Fig. 3