
|
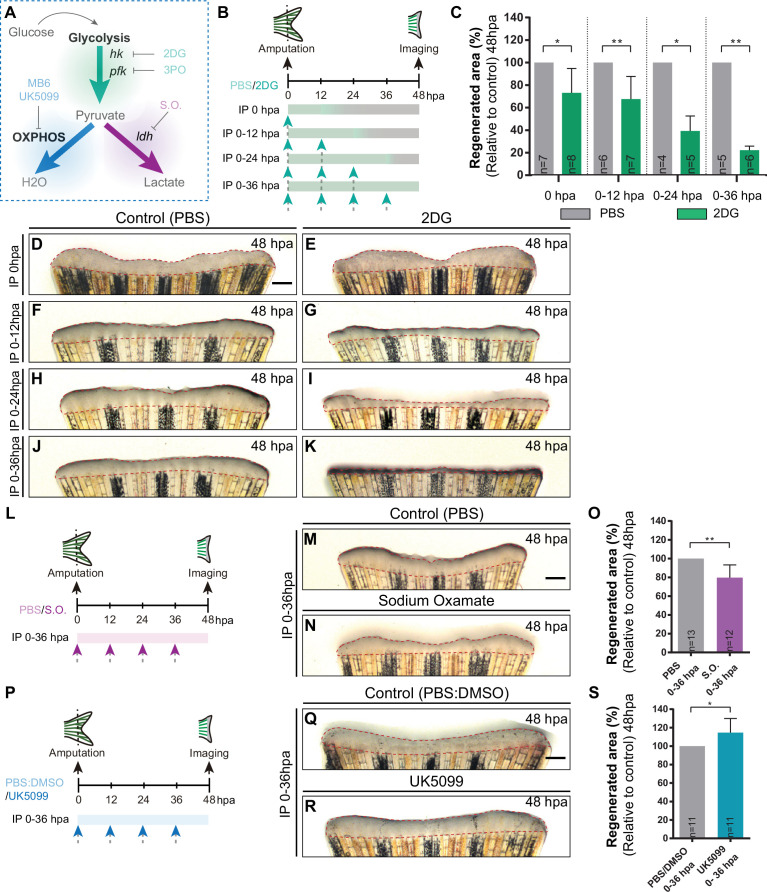
Fig. 3
(A) Schematic representation of the compounds used to manipulate glucose metabolism. (B) Experimental design used to inhibit the glycolytic influx during fin regeneration. Control and treated fish are administered, via IP injection, with vehicle (PBS) or glycolytic inhibitor, 2DG, respectively, every 12 hr, from fin amputation (0 hpa) until 48 hpa. Different time-intervals were used for injections: (0 hpa) IP injection at (0 hpa; 0–12 hpa) IP injection at 0 and 12 hpa; (0–24 hpa) IP injection at 0, 12, and 24 hpa; (0–36 hpa) IP injection at 0, 12, 24, and 36 hpa. (C) Quantification of the total fin regenerated area at 48 hpa, after vehicle (PBS) or 2DG injection, at specific time-intervals during regeneration. (D–K) Representative images of 48 hpa fins treated with (D,F,H,J) vehicle (PBS) or (E,G,I,K) 2DG during different time-intervals. (L) Experimental design used to inhibit the lactate formation during fin regeneration. Fish are administered, via IP injection, with vehicle (PBS) or S.O. every 12 hr, from fin amputation (0 hpa) until 48 hpa. (M, N) Representative images of 48 hpa caudal fin treated with (M) vehicle (PBS) or (N) S.O. (O) Quantification of the total fin regenerated area at 48 hpa, after vehicle (PBS) or with S.O. injection. (P) Experimental design used to inhibit pyruvate translocation to mitochondria during fin regeneration. Fish are administered, via IP injection, with vehicle (PBS) or MPC inhibitor, UK5099, every 12 hr from fin amputation (0 hpa) until 48 hpa. (Q, R) Representative images of 48 hpa fins treated with (Q) PBS:DMSO (control) or (R) UK5099. (S) Quantification of the total fin regenerated area at 48 hpa, after vehicle (PBS) or with UK5099 injection. For all graphs, statistical analysis corresponds to Mann-Whitney test with Mean ± SD, sample number is displayed on each column and corresponds to single fish. Scale bar represents 500 µm. Dashed lines define the regenerated tissue. * p<0.05, ** p<0.01. See Figure 3—source data 1.