
Image
|
Figure Caption
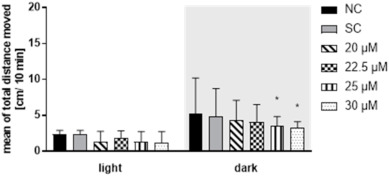
Fig. 4
Fig. 4. Bar graphs from the LDT test using 5 dpf embryos and exposed for five days to dichlorvos. Data are displayed as mean of the total distance moved/10 min time interval. Error bars indicate the standard deviation. Data were derived from three replicates with 12 organisms each. SC = 0.01% DMSO, n = 3, * = p < 0.05.
Acknowledgments
This image is the copyrighted work of the attributed author or publisher, and
ZFIN has permission only to display this image to its users.
Additional permissions should be obtained from the applicable author or publisher of the image.
Full text @ Chemosphere