
Image
|
Figure Caption
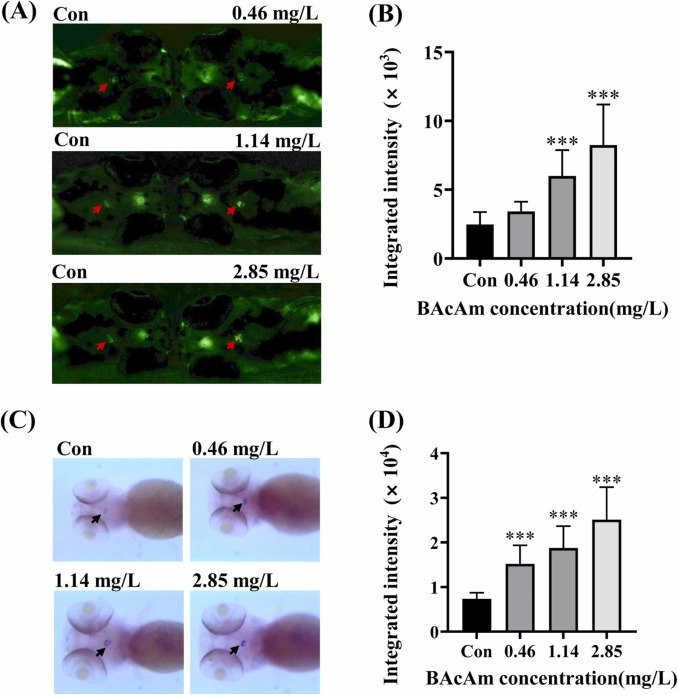
Fig. 4 Fig. 4. Effects of BAcAm on zebrafish tshβ mRNA expression. [A] EGFP expression in the pituitary gland of tshβ: EGFP transgenic fish (ventral views). [B] Quantitative analysis of EGFP integrated densities (IDs). [C] Whole in-situ hybridization showed the endogenous tshβ mRNA expression in the pituitary of WT zebrafish (ventral views). [D] Quantitative analysis of whole in-situ hybridization IDs. Values are the mean ± SEM. (***P < 0.001).
Acknowledgments
This image is the copyrighted work of the attributed author or publisher, and
ZFIN has permission only to display this image to its users.
Additional permissions should be obtained from the applicable author or publisher of the image.
Full text @ Ecotoxicol. Environ. Saf.