
|
Fig. 4
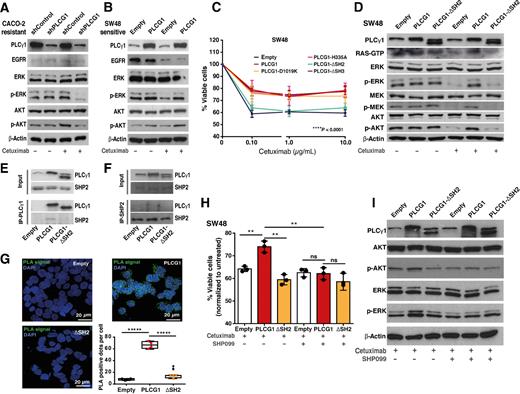
Role of PLCγ1 nSH2-CSH2 domains and its interaction with SHP2 for cetuximab resistance. A and B, Western blotting of CACO-2 (shControl and shPLCG1) and SW48 (parental and pTriex-PLCG1 overexpressed) cells treated with cetuximab for 72 hr. EGFR downstream signaling, namely ERK and AKT are shown. β-actin was used as the loading control. C, Cell viability of parental SW48 and PLCG1-overexpressing cells: full length WT; constitutively active mutant - D1019K; constitutively inactive mutant - H335A; deletion of both nSH2-CSH2 tandem domains - ΔSH2; and deletions of SH3 domain - ΔSH3 (n = 3). Analysis was performed using two-way ANOVA test (****P < 0.0001). D, Western blotting of EGFR downstream signaling of SW48 parental and overexpressing PLCG1 WT and PLCG1 ΔSH2 mutant, after 72 hr of cetuximab treatment. β-Actin was used as the loading control. E, Co-immunoprecipitation of PLCγ1 with anti-Stag antibody and Western blot analysis of PLCγ1 and SHP2 of 72 hours cetuximab treated SW48 cells. F, Co-immunoprecipitation of SHP2 with anti-SHP2 antibody and Western blot analysis of PLCγ1 and SHP2 of 72 hours cetuximab treated SW48 cells. G, Proximity ligation assay of PLCγ1 and SHP2 using anti-Stag and anti-SHP2 antibodies in SW48 parental, PLCG1 WT- and ΔSH2-overexpressing cells and corresponding quantification (n = 4). H, Cell viability of SW48 parental and overexpressing PLCG1 WT and ΔSH2 mutant, treated with cetuximab and cetuximab + SHP099 for 72 hours (n = 3). I, Western blotting of EGFR downstream signaling of SW48 parental and overexpressing PLCG1 WT and ΔSH2 mutant, treated with cetuximab and cetuximab + SHP099. Results are presented as the mean ± SEM. Statistical analysis was performed using unpaired t test [not significant (ns), P > 0.05; **, P < 0.01].