
|
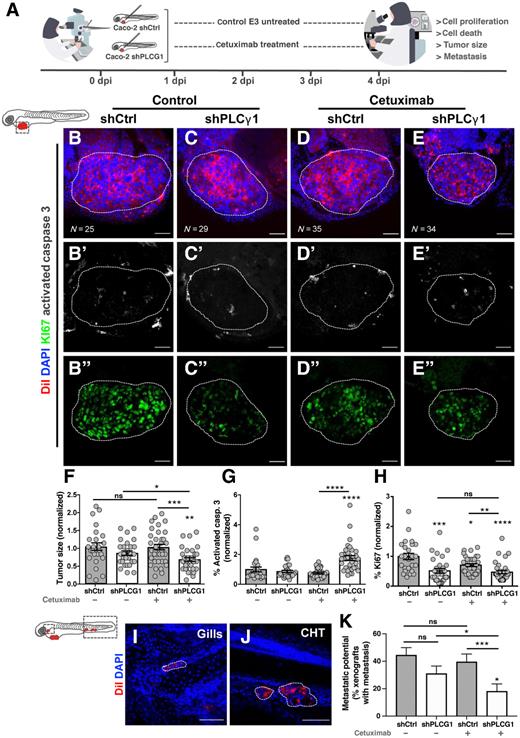
Fig. 2
Zebrafish xenotransplant model of shControl and shPLCG1 CACO-2 cells treated with cetuximab. A, Human cancer cell line CACO-2 (shCtrl and shPLCG1) was fluorescently labeled with DiI (red) and injected into the perivitelline space (PVS) of 2 days postfertilization (dpf) nacre/casper zebrafish larvae. Zebrafish xenografts were treated in vivo with cetuximab for 72 hours and compared with untreated controls regarding tumor size, cell death, cell proliferation, and metastasis formation. B–E”, At 4 dpi, zebrafish xenografts were imaged on PVS and over the zebrafish body by confocal microscopy. F, Analysis of tumor size (*, P = 0.0387; **, P = 0.0063; ***, P = 0.0007). G, Analysis of activated caspase 3 (apoptosis; ****, P < 0.0001). H, Percentage of Ki-positive cells (*, P = 0.0191; **, P = 0.0021; ***, P = 0.0001; ****, P< 0.0001). I and J, Representative images of CACO-2 micrometastasis. K, Metastasis quantification (shPLCG1 versus shPLCG1 cetuximab *P = 0.0238, shCTRL versus shPLCG1 cetuximab *P = 0.0124, shCTRL cetuximab versus shPLCG1 cetuximab ***P = 0.0004). The outcomes are expressed as AVG ± SEM. Results are from two independent experiments and the number of xenografts analyzed are indicated in the representative images. Each dot represents one zebrafish xenograft. Statistical analysis was performed as described in Statistical Analysis section (ns > 0.05; *, P ≤ 0.05; **P ≤ 0.01; ***P ≤ 0.001, ****P ≤ 0.0001). Scale bars represent 50 μm. All images are anterior to the left, posterior to right, dorsal up, and ventral down.