
Fig. 4
- ID
- ZDB-IMAGE-220822-19
- Publication
- Agarwala et al., 2022 - Defining the ultrastructure of the hematopoietic stem cell niche by correlative light and electron microscopy
- All Figures
- Figures for Agarwala et al., 2022
|
Fig. 4
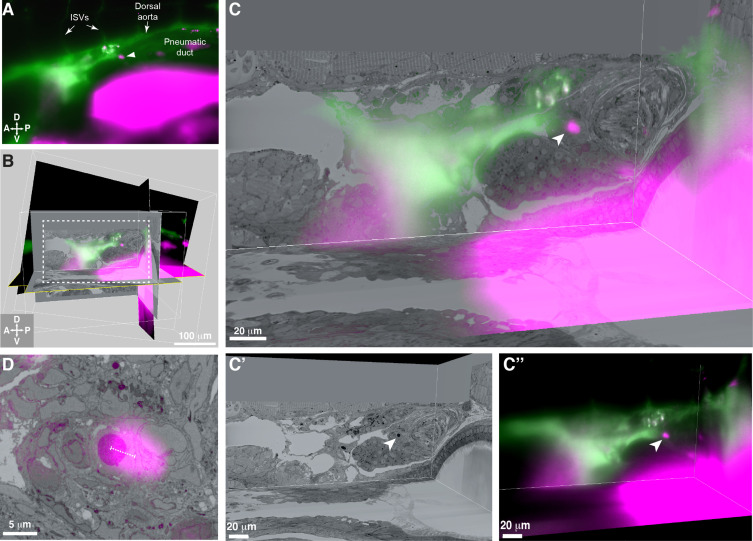
(A) Single Z plane from light sheet imaging of drl:APEX2-mCherry+ transgenic larva showing the lodged mCherry+ HSPC (white arrowhead). (B) Global alignment of 3D rendered models generated from light sheet and SBEM datasets using Imaris software. (C) Orthogonal views of the white boxed region within B shows a 3D view of the alignment between light sheet and SBEM datasets. White arrowhead points to the single lodged HSPC in the aligned light sheet and SBEM datasets. (C’) APEX2+ HSPC in SBEM data. (C’’) mCherry+ HSPC in light sheet data. Green: Injected Oregon Green dextran dye marking vessels. Magenta: Runx:mCherry+ HSPCs and autofluorescence in gut. (D) Detail of the alignment shows mCherry+ HSPC and APEX2+ HSPC are <5 µm apart (dotted white line). Abbreviations: ISVs, intersegmental vessels; D, dorsal; V, ventral; A, anterior; P, posterior.