
|
Fig. 5
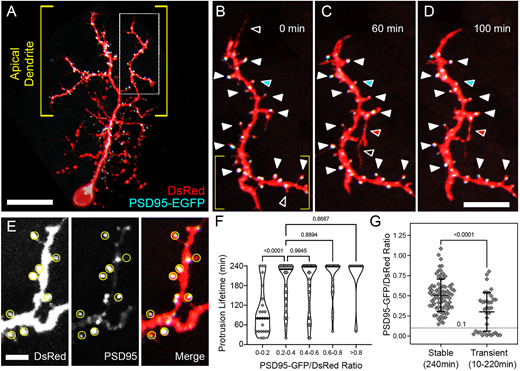
PSD95-EGFP dynamics in PyrN apical dendrites. (A) Native orientation view of a 6 dpf PSD95-EGFP/DsRed-labeled PyrN. (B-D) Time-lapse images of PSD95-EGFP localization in a dendrite subregion, as indicated by the boxed region in A. White arrowheads mark seven PSD95-positive spines that were present during the entire 4 h recording. For clarity, some stable spines with PSD95 accumulations are not marked by arrowheads. Open arrowheads indicate PSD95-negative protrusions that were retracted during the time-lapse imaging. Red arrowheads indicate a protrusion that extended, formed a PSD95-EGFP punctum and was stabilized from 60 to 100 min. Cyan arrowheads indicate a spine containing a PSD95 punctum that was retracted while the punctum persisted. (E) Magnified view of subregion indicated by the yellow brackets in B. DsRed (left), PSD95-EGFP (middle) and merged (right) fluorescence channels are shown separately. Yellow circles indicate regions of interest used to calculate PSD95-EGFP/DsRed signal ratios. Note the wide range of PSD95-EGFP intensities within the analysis regions (middle and right panels). (F) Quantification of protrusion lifetimes for spines binned into groups based on their degree of PSD95-EGFP enrichment (PSD95-EGFP/DsRed ratio). Note that there is a wide range of lifetimes for protrusions with the lowest PSD95-EGFP enrichment (ratios from 0-0.2), whereas the majority of protrusions with intermediate (0.2-0.6) or high (>0.6) PSD95-EGFP enrichment values were stable during the 4 h recording. The median for each group is indicated with a horizontal line. One-way ANOVA with Tukey's multiple comparisons test was used to determine significance. Significant differences not shown on graph: 0-0.2 versus 0.4-0.6, P<0.0001; 0-0.2 versus 0.6-0.8, P<0.0001; 0-0.2 versus >0.8, P<0.0001. Analysis was performed on 156 protrusions from five neurons. (G) Comparison of PSD95-EGFP/DsRed ratios between stable and transient protrusions. Note that both groups have many spines with intermediate values, but only the stable group has several spines with ratios >0.8. Conversely, only the transient group contains protrusions with ratios <0.1. Data are shown as mean±s.d. Two-tailed unpaired t-test was used to determine significance. Scale bars: 20 µm (A); 8 µm (B-D); 2.5 µm (E).