
Image
|
Figure Caption
Fig. 6
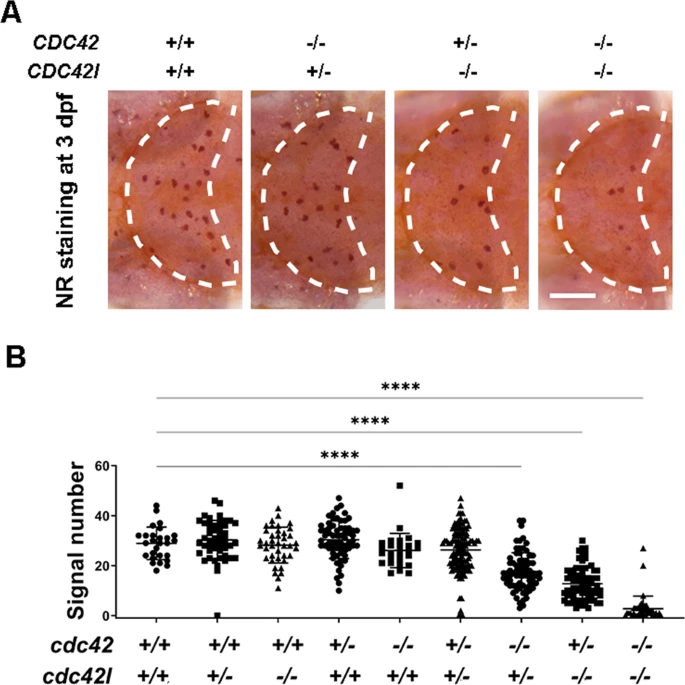
A Representative image of NR staining in cdc42-20bpcdc42l−29bp double mutants at 3 dpf. B Quantification of NR signals in cdc42−20bpcdc42l−29bp double mutants at 3 dpf. Group sizes were at least n = 48 zebrafish embryos. Each dot represents one larva. White dashed lines indicate the optic tectum. Scale bar = 100 µm. Data were analyzed by one-way ANOVA followed by Dunnett’s multiple comparisons test. ****P ≤ 0.0001.
Figure Data
Acknowledgments
This image is the copyrighted work of the attributed author or publisher, and
ZFIN has permission only to display this image to its users.
Additional permissions should be obtained from the applicable author or publisher of the image.
Full text @ Cell Death Discov