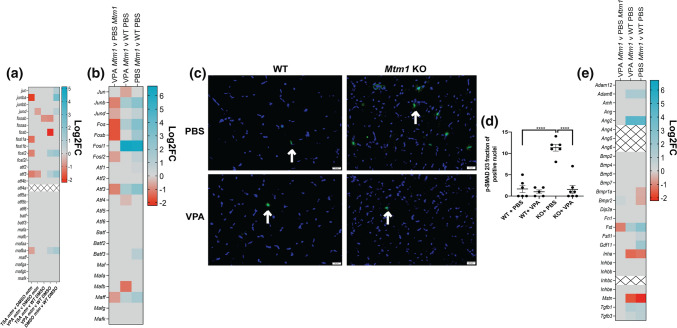
Fig. 5
TGF beta signalling is altered in Mtm1 KO mice and improved with VPA. a, b Heat maps showing expression changes (as determined with RNA sequencing) in AP-1 pathway genes in mtm zebrafish and Mtm1 KO mice, respectively. c p-SMAD 2/3 immunofluorescence on tibialis anterior muscle at 35 days of age. d Quantification of p-SMAD 2/3 immunostaining. An increased proportion of myofibers with nuclear p-SMAD is observed in Mtm1 KO mice. Values are Mean ± SEM. p-SMAD2/3 fraction of positive nuclei (WT + PBS &KO + PBS n = 6, WT + VPA n = 5, KO + VPA n = 7). PBS treated Mtm1 = 11 ± 1 vs PBS treated WT = 1.7 ± 0.8, (****p < 0.0001) vs VPA treated Mtm1 KOs = 1.6 ± 0.95 (****p < 0.0001) vs VPA treated WTs = 1.0 ± 0.45 (****p < 0.0001). Note that staining was confirmed to be within myofibers using double IIF with anti-dystrophin. e Heat map showing expression changes in follistatin interacting gene products in Mtm1 KO mice. For all heat maps, grey indicates genes that did not meet cut-offs (padj < 0.01), and crossed boxes show genes that were not detected. Statistical analysis by one-way ANOVA using Dunnett's multiple comparisons test. Scale bar = 20 μm

