IMAGE

Figure 2

ID
ZDB-IMAGE-220816-41
Genes
Source
Figures for Sertori et al., 2022
Image
Figure Caption

Figure 2

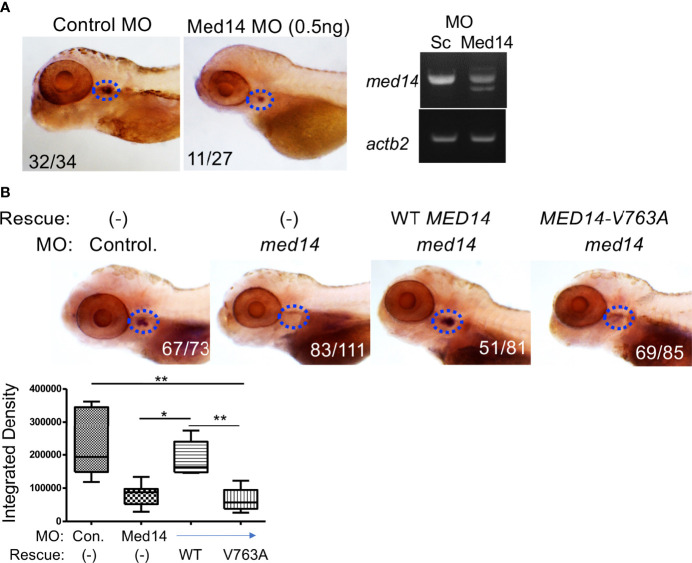
Role of Med14 in Zebrafish T cell Development. (A) The effect of MO knockdown of med14 on T cell development at 5 dpf was assessed by WISH using an lck probe to identify T cells. The numbers on the images reflect the fraction of the embryos with the depicted staining pattern. Thymus staining is outlined by blue dashed ovals. The panel on the right confirms MO induced mis-splicing of med14 mRNA by RT-PCR at 1 dpf with β-actin (actb2) as a loading control. (B) The ability of the wild type and human MED14 variant to rescue loss of endogenous zebrafish med14 was assessed by heat-inducible re-expression of wild type or variant MED14. The effect on T cell development was assessed as above by WISH using an lck probe. The integrated density of WISH staining was measured by ImageJ software and depicted graphically as box plots. Significantly altered groups are indicated. Data are representative of 3 experiments. * p < 0.05, ** p < 0.01.

Figure Data
Acknowledgments
This image is the copyrighted work of the attributed author or publisher, and ZFIN has permission only to display this image to its users. Additional permissions should be obtained from the applicable author or publisher of the image. Full text @ Front Immunol