
|
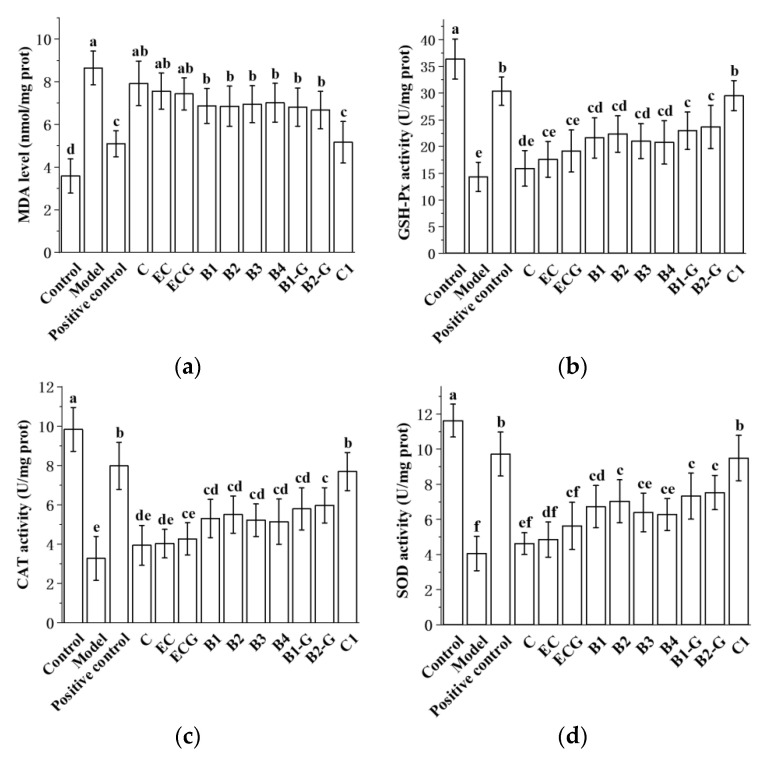
Fig. 9
Effects of different structural procyanidins on oxidative stress in the zebrafish PD model. (a) MDA levels. (b) GSH-Px activity. (c) CAT activity. (d) SOD activity. Control, Blank control group; Model, MPTP (400 μM); Positive control, Deprenyl (40 μM) + MPTP (400 μM); C: C (25 μM) + MPTP (400 μM); EC: EC (25 μM) + MPTP (400 μM); ECG: ECG (25 μM) + MPTP (400 μM); B1: B1 (25 μM) + MPTP (400 μM); B2: B2 (25 μM) + MPTP (400 μM); B3: B3 (25 μM) + MPTP (400 μM); B4: B4 (25 μM) + MPTP (400 μM); B1-G: B1-G (25 μM) + MPTP (400 μM); B2-G: B2-G (25 μM) + MPTP (400 μM); C1: C1 (25 μM) + MPTP (400 μM). Data are expressed as the mean ± SD. All experiments were conducted three times. Different letters (a–f) on the bar represent significant differences, while the same letters represent no significant differences (p < 0.05, one-way ANOVA).