
IMAGE
Fig. 6
- ID
- ZDB-IMAGE-220812-22
- Publication
- D'Agostino et al., 2022 - Loss of circadian rhythmicity in bdnf knockout zebrafish larvae
- All Figures
- Figures for D'Agostino et al., 2022
Image
|
Figure Caption
Fig. 6
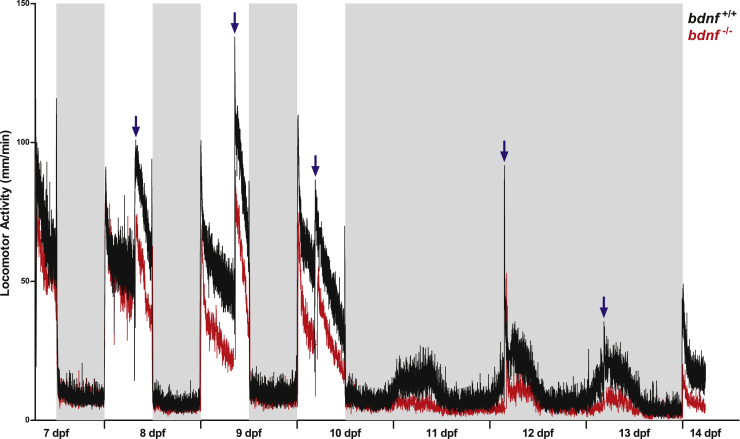
Daily and circadian activity rhythms of bdnf+/+ and bdnf−/− zebrafish larvae
Mean waveform of locomotor activity under 12:12 LD cycles from 7 to 10 dpf and DD from 10 to 13 dpf (n = 32/genotype). Vertical axis shows the average distance moved (mm/1 min), whereas X axis indicates time in recording. White and gray bars show light and dark phases, respectively. Blue arrows indicate feeding time. Data are expressed as mean ± SEM.
Figure Data
Acknowledgments
This image is the copyrighted work of the attributed author or publisher, and
ZFIN has permission only to display this image to its users.
Additional permissions should be obtained from the applicable author or publisher of the image.
Full text @ iScience