
Image
|
Figure Caption
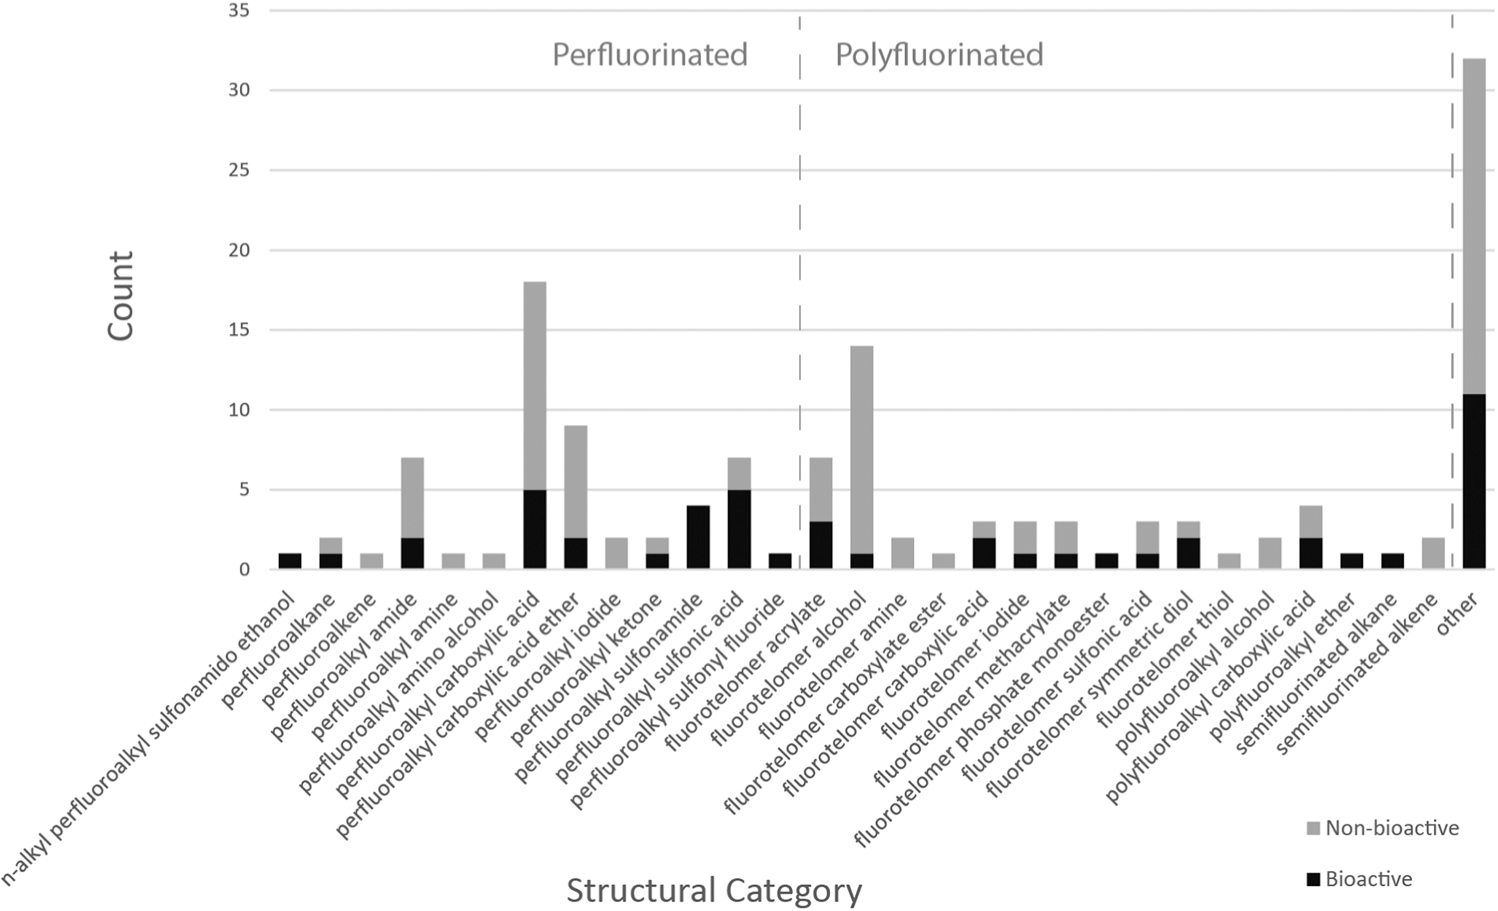
Fig. 4
Bar plot showing breakdown of PFAS into structural categories. Within each bar, the black shaded regions represent the number of PFAS that induced at least one hit in any of the assays and gray represents the number that were not a hit. The gray dotted line in the center of the bar plot divides the PFAS into perfluorinated (left) and polyfluorinated (right, except for the other category).
Acknowledgments
This image is the copyrighted work of the attributed author or publisher, and
ZFIN has permission only to display this image to its users.
Additional permissions should be obtained from the applicable author or publisher of the image.
Reprinted from Journal of hazardous materials, 431, Truong, L., Rericha, Y., Thunga, P., Marvel, S., Wallis, D., Simonich, M.T., Field, J.A., Cao, D., Reif, D.M., Tanguay, R.L., Systematic developmental toxicity assessment of a structurally diverse library of PFAS in zebrafish, 128615, Copyright (2022) with permission from Elsevier. Full text @ J. Hazard. Mater.