
Fig. 6
- ID
- ZDB-IMAGE-220810-58
- Publication
- Fu et al., 2022 - N-methyl-N-nitrosourea induces zebrafish anomalous angiogenesis through Wnt/β-catenin pathway
- All Figures
- Figures for Fu et al., 2022
|
Fig. 6
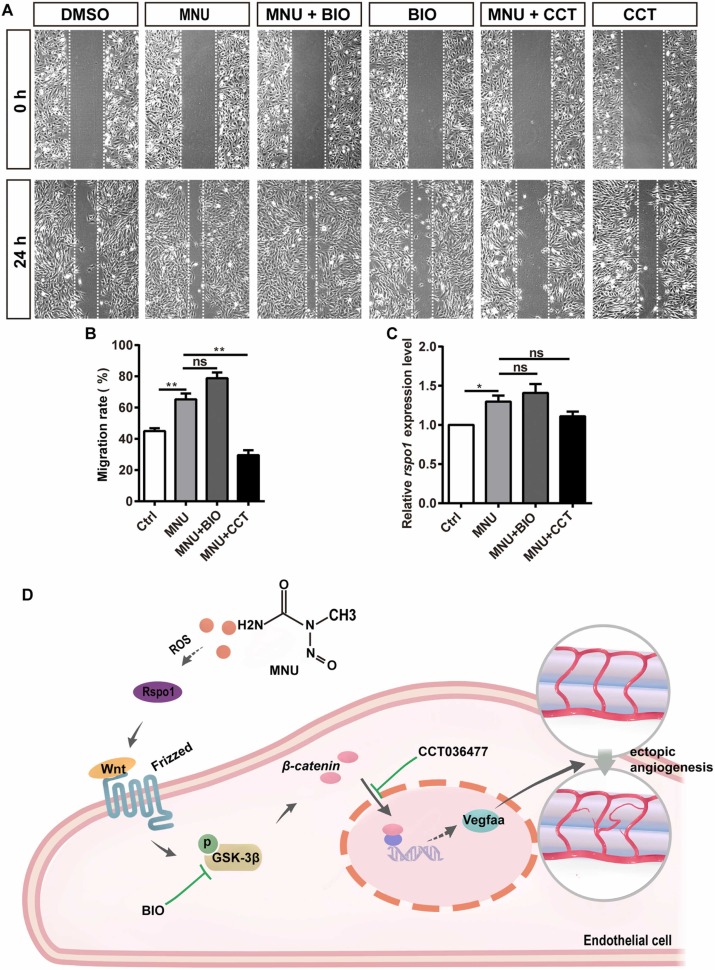
Fig. 6. The effect of MNU on endothelial migration and the model of MNU on zebrafish angiogenesis. A. Representative images of wound healing assay of bEnd.3 cells from control group, MNU-treated group, BIO-treated group and BIO plus MNU-treated group, CCT-treated group, and CCT plus MNU-treated group at 24 h. B. Quantitative analysis of migration rate of the control group, MNU-treated group, BIO plus MNU-treated group and CCT plus MNU-treated group at 24 h. BIO, (2'Z,3'E)− 6-bromoindirubin-3'-oxime; CCT, CCT036477. Data are shown as the mean ± SEM. * * P < 0.01. C. Quantitative analysis of rspo1 expression in the control group, MNU-treated group, BIO plus MNU-treated group and CCT plus MNU-treated group by qPCR. Data are shown as the mean ± SEM. * P < 0.05. D. Schematic model of MNU in promoting embryonic angiogenesis.