
Image
|
Figure Caption
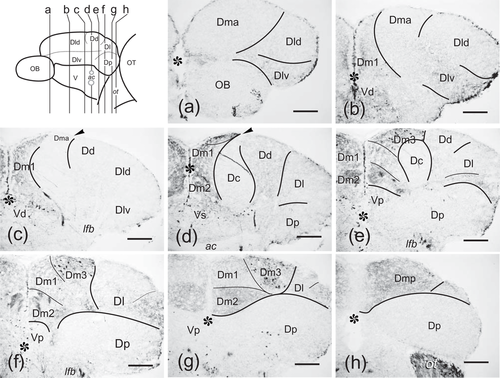
Fig. 2
(a–h) Photomicrographs of transverse sections through the zebrafish pallium at precommissural (a–c), commissural (d), and postcommissural (e–h) levels, showing calretinin immunoreactivity. Note differences in fiber density and presence of immunoreactive cells that were used to outline zones and subregions. Asterisks: midline telencephalic ventricle. Arrowheads: sulcus ypsiloniformis. For abbreviations, see the list. Scale bars: 100 μm
Acknowledgments
This image is the copyrighted work of the attributed author or publisher, and
ZFIN has permission only to display this image to its users.
Additional permissions should be obtained from the applicable author or publisher of the image.
Full text @ J. Comp. Neurol.