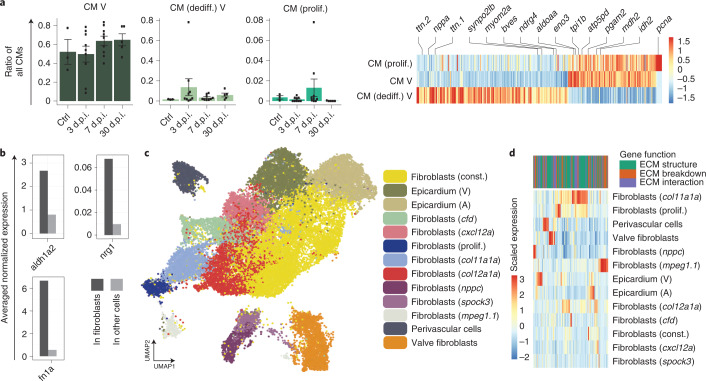
a, Left: relative changes in abundance of different subtypes of CMs across the time points (n = 3, 9, 9, 5 animals; error bars show s.e.m.). Right: differentially expressed genes between subtypes of CMs. b, Comparison of average normalized expression of known proregenerative factors in fibroblasts and other cell types. The comparison used data pooled over all time points, and fibroblasts were defined as all cells in the yellow cluster in Fig. 1b. c, UMAP representation of the subclustering of col1a1a-expressing cells. d, Expression of ECM-related genes in different fibroblast cell types. The genes were classified according to their contribution to structure, breakdown or interaction of the ECM. A, atrium; Ctrl., control; const., constitutive; dediff., dedifferentiated; prolif., proliferating; V, ventricle.
Source data
Acknowledgments
This image is the copyrighted work of the attributed author or publisher, and
ZFIN has permission only to display this image to its users.
Additional permissions should be obtained from the applicable author or publisher of the image.
Full text @ Nat. Genet.
Your Input Welcome
Thank you for submitting comments. Your input has been emailed to ZFIN curators who may contact you if
additional information is required.
Oops. Something went wrong. Please try again later.