
Fig. 4
- ID
- ZDB-IMAGE-220808-58
- Genes
- Publication
- Lusk et al., 2021 - Pax2a, but not pax2b, influences cell survival and periocular mesenchyme localization to facilitate zebrafish optic fissure closure
- All Figures
- Figures for Lusk et al., 2021
|
Fig. 4
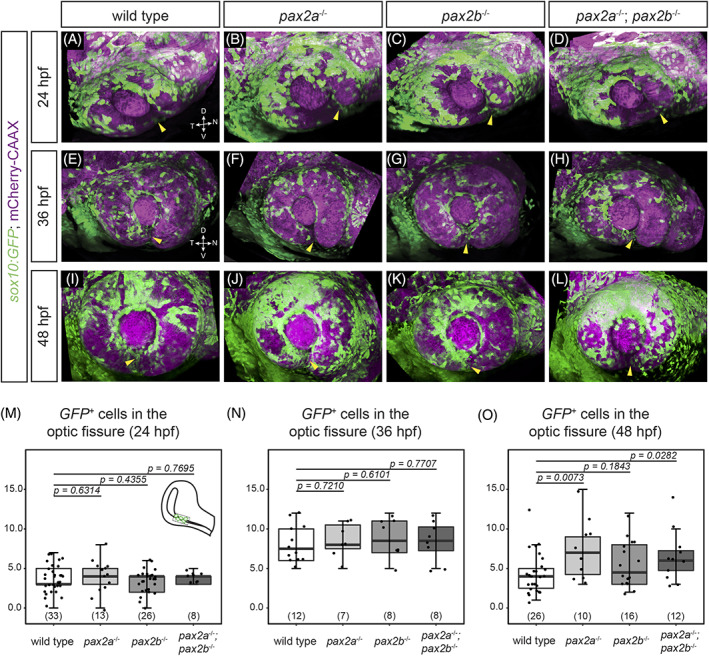
Tg(sox10:GFP)‐positive neural crest cells properly localize in the optic fissure, but persist in pax2a and pax2a; pax2b mutants. Embryos visualized for neural crest (green; Tg(sox10:GFP)) and cell membranes (magenta; mCherry‐CAAX) at 24 hpf (A‐D), 36 hpf (E‐H), and 48 hpf (I‐L). All images are lateral views of three‐dimensional renderings. (A) Wild‐type, (B) pax2a tu29a , (C) pax2b sa10953 , (D) and pax2a tu29a ; pax2b sa10953 embryos at 24 hpf. GFP‐positive cells are located within the fissure in each genotype (yellow arrowheads). (E) Wild‐type, (F) pax2a tu29a , (G) pax2b sa10953 , (H) and pax2a tu29a ; pax2b sa10953 mutant embryos at 36 hpf. (I) Wild‐type, (J) pax2a tu29a , (K) pax2b sa10953 , (L) and pax2a tu29a ; pax2b sa10953 mutant embryos at 48 hpf. (M‐O) Quantification of GFP‐positive cells throughout the depth of the optic fissure within the optic cup, 24 hpf (M); 36 hpf (N); and 48 hpf (O). n (embryos) shown at base of graphs. P‐values for (M‐O) were calculated using an unpaired Student's t‐test. Schematic (M) shows the region of the optic fissure through the optic cup in which transgene‐positive cells were quantified