
Image
|
Figure Caption
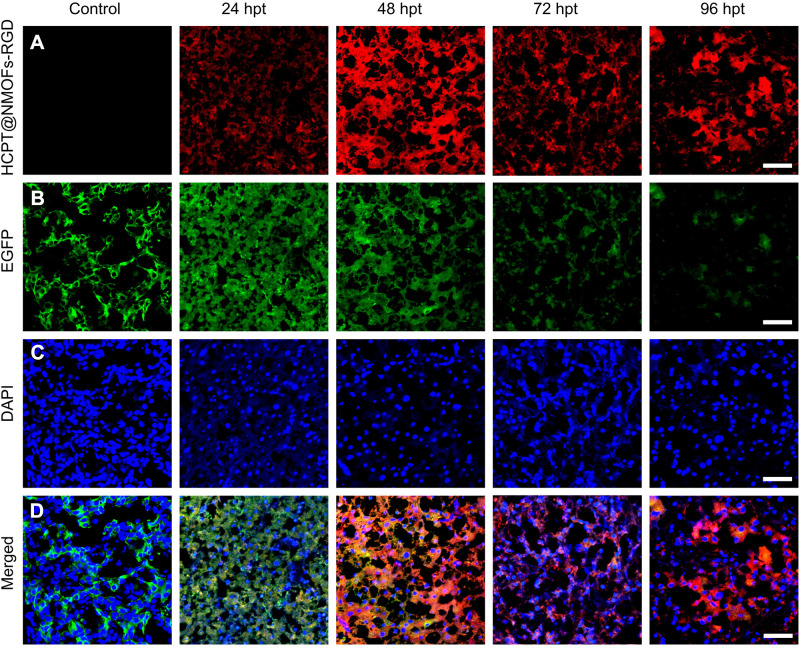
Fig. 7
Time-lapse appearance of livers in HCC-bearing zebrafish following HCPT@NMOFs-RGD treatment. (A) Images of HCPT@NMOFs-RGD distribution in livers at 0 (control), 24, 48, 72, and 96 hours post treatment (hpt). (B) Images of EGFP fluorescence. (C) DAPI staining. (D) Merged images of (A–C). Scale bar: 20 μm.
Acknowledgments
This image is the copyrighted work of the attributed author or publisher, and
ZFIN has permission only to display this image to its users.
Additional permissions should be obtained from the applicable author or publisher of the image.
Full text @ Int. J. Nanomedicine