
Image
|
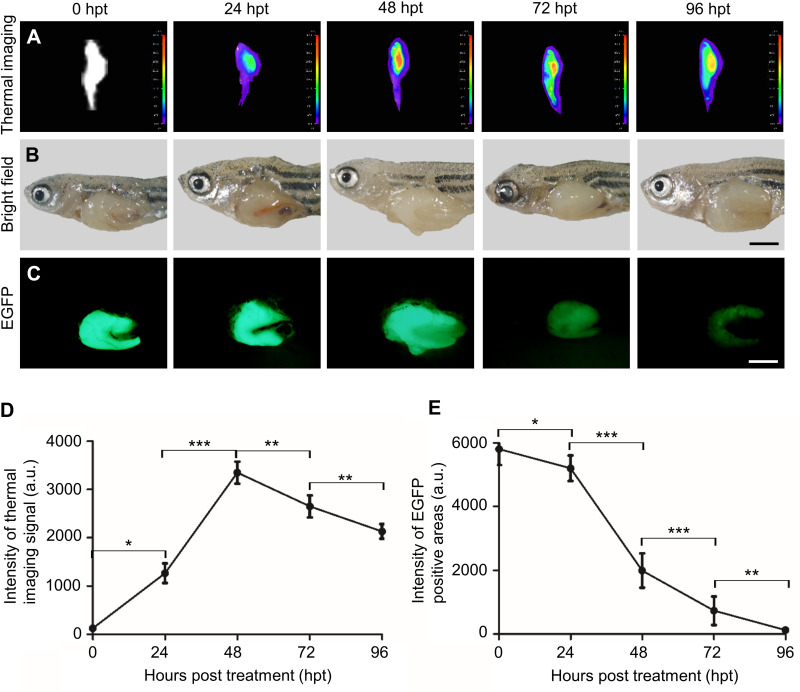
Figure Caption
Fig. 6
The chemotherapeutic effect of HCPT@NMOFs-RGD in HCC-bearing zebrafish. (A) Thermal imaging, (B) bright field, and (C) EGFP fluorescence of HCC-bearing zebrafish following HCPT@NMOFs-RGD treatment at 0 (control), 24, 48, 72, and 96 hours post treatment (hpt). (D) Statistical analysis of the intensity of thermal imaging (n=3 at each time point; ANOVA, *P<0.05, **P<0.01, ***P<0.001). (E) Statistical analysis of the intensity of EGFP-positive areas (n=3 at each time point; ANOVA, *P<0.05, **P<0.01, ***P<0.001). Scale bar in (B and C): 200 μm.
Acknowledgments
This image is the copyrighted work of the attributed author or publisher, and
ZFIN has permission only to display this image to its users.
Additional permissions should be obtained from the applicable author or publisher of the image.
Full text @ Int. J. Nanomedicine