
Image
|
Figure Caption
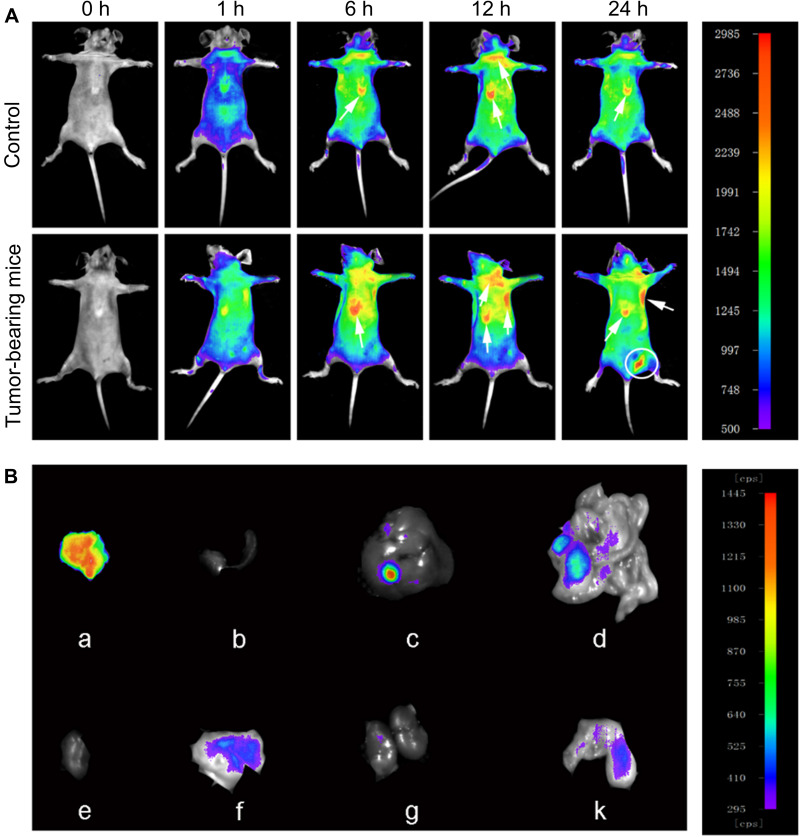
Fig. 5
Time-lapse distribution of NMOFs-RGD in tumor-bearing mice. (A) Thermal images of NMOFs-RGD in control and tumor-bearing mice at 0, 1, 6, 12, and 24 hours (h) postinjection. (B) Thermal images of NMOFs-RGD in different organs of tumor-bearing mice: (a) tumor, (b) spleen, (c) liver, (d) intestine, (e) heart, (f) stomach, (g) kidney, and (k) lung.
Acknowledgments
This image is the copyrighted work of the attributed author or publisher, and
ZFIN has permission only to display this image to its users.
Additional permissions should be obtained from the applicable author or publisher of the image.
Full text @ Int. J. Nanomedicine