
Image
|
Figure Caption
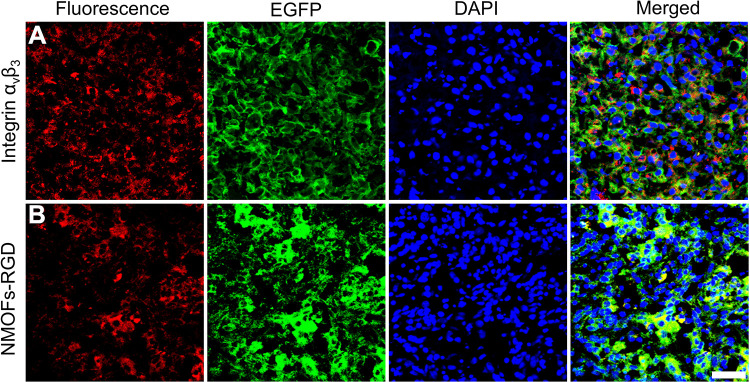
Fig. 4
Targeted delivery of NMOFs-RGD to tumor tissue in HCC-bearing zebrafish. (A) The expression of integrin αvβ3. Red fluorescent signals are from integrin αvβ3-expressing cells. (B) The distribution of NMOFs-RGD in the liver of HCC krasG12V zebrafish. Red fluorescent signals are from NMOFs-RGD. Scale bar: 20 μm.
Acknowledgments
This image is the copyrighted work of the attributed author or publisher, and
ZFIN has permission only to display this image to its users.
Additional permissions should be obtained from the applicable author or publisher of the image.
Full text @ Int. J. Nanomedicine