
Image
|
Figure Caption
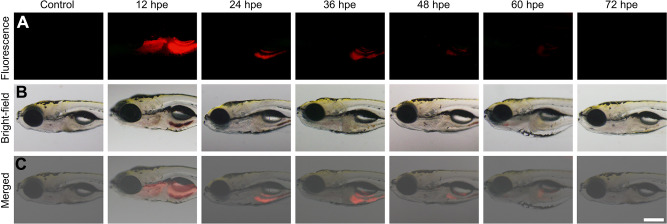
Fig. 3
Time-lapse distribution of NMOFs-RGD in zebrafish larvae. (A) Fluorescence and (B) bright field images of NMOFs-RGD-exposed larvae at different hours post exposure (hpe). Red fluorescence was emitted by NMOFs-RGD. (C) Merged images from (A and B). Scale bar: 100 μm.
Acknowledgments
This image is the copyrighted work of the attributed author or publisher, and
ZFIN has permission only to display this image to its users.
Additional permissions should be obtained from the applicable author or publisher of the image.
Full text @ Int. J. Nanomedicine