
Fig. 5
- ID
- ZDB-IMAGE-220808-4
- Publication
- Ding et al., 2022 - Leptin mutation and mycobacterial infection lead non-synergistically to a similar metabolic syndrome
- All Figures
- Figures for Ding et al., 2022
|
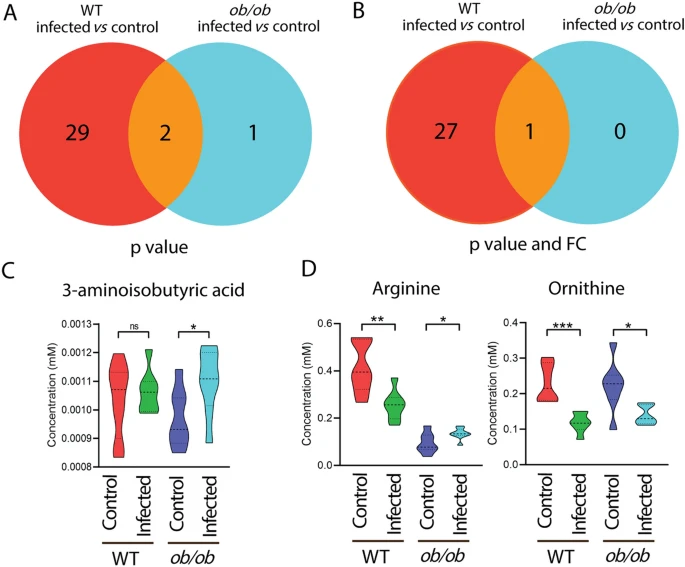
Fig. 5
Venn diagrams show the number of metabolites measured by mass spectrometry in response to infection in the blood of wild type and ob/ob mice. A A Venn diagram shows the number of metabolites in response to Mtb infection in the blood of WT and ob/ob mice with p < 0.05. WT wild type. B A Venn diagram shows the number of metabolites in response to Mtb infection in the blood of wild type and ob/ob mice with p < 0.05 and FC > 1.5 or FC < − 1.5. FC fold change. C Quantification of the one metabolite 3-aminoisobutyric acid in A. *p < 0.05. ns non-significant. D Quantification of the two common metabolites arginine and ornithine in A. *p < 0.05, **p < 0.01, ***p < 0.001