
IMAGE
Fig. 3
- ID
- ZDB-IMAGE-220804-17
- Publication
- Delnoy et al., 2022 - Novel mRNA therapy restores GALT protein and enzyme activity in a zebrafish model of classical galactosemia
- All Figures
- Figures for Delnoy et al., 2022
Image
|
Figure Caption
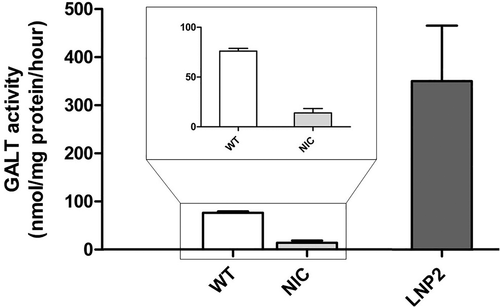
Fig. 3
hGALT activity in 5 dpf CG zebrafish (galt KO) after single dose intravenous hGALT mRNA injection (100 ng/μl). Results are presented as mean ± SEM. All samples (n = 6 for wildtype zebrafish and n = 4 for NIC and LNP2 injected zebrafish, ~90 zebrafish/sample), were measured in duplicate. WT, wild-type; NIC, non-injected CG zebrafish (galt KO) control; LNP2, LNP2-packaged hGALT mRNA injected CG zebrafish (galt KO)
Figure Data
Acknowledgments
This image is the copyrighted work of the attributed author or publisher, and
ZFIN has permission only to display this image to its users.
Additional permissions should be obtained from the applicable author or publisher of the image.
Full text @ J. Inherit. Metab. Dis.