
Image
|
Figure Caption
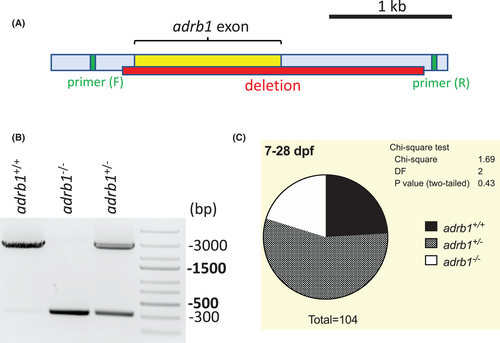
Fig. 1
The generation and screening of an adrb1 knockout (adrb1−/−) zebrafish line. (A) Schematic illustration of the adrb1 gene within chromosome 12 including the single exon, the deleted segment (confirmed by Sanger sequencing), and sequencing primer targets. See Supplementary Material for annotated sequence. (B) Polymerase chain reaction with the sequencing primers generated a ~3000 bp wild-type band (adrb1+/+), a ~300 bp mutant band only (adrb1−/−) or both bands (adrb1+/−). (C) The results of F1 heterozygote (adrb1+/) incrosses generated offspring in the expected Mendelian ratio (compared with Chi-square test, p = 0.43; adrb1+/+ 24.04%, adrb1+/− 55.77%, adrb1−/− 20.19%). Note that this figure includes pooled data from the populations sampled at 7 and 28 dpf; for each subsample (age) see Figure S2.
Acknowledgments
This image is the copyrighted work of the attributed author or publisher, and
ZFIN has permission only to display this image to its users.
Additional permissions should be obtained from the applicable author or publisher of the image.
Full text @ Acta Physiol. (Oxf).