
|
Fig. 3
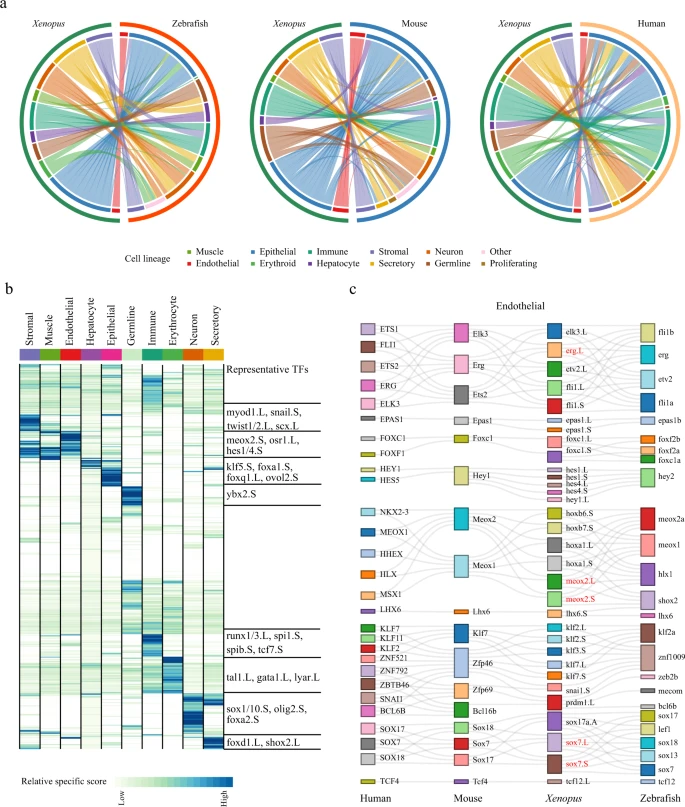
a Circle plot showing the similarity of cell lineages in Xenopus laevis, zebrafish (left), mice (middle), and humans (right). Pairs of cell types with mapping scores greater than 0.1 are connected by lines. Cell lineages are labeled in different colors. b Heatmap showing the specific scores of TFs in Xenopus for each cell type. Each row represents one TF, and each column represents one cell lineage. Cell lineages are labeled in different colors. The representative TFs in each cell lineage are presented in the right panel. c Sankey plot showing common lineage-specific transcription factors in endothelial for four vertebrates (humans, mice, Xenopus, and zebrafish). The representative TFs in Xenopus laevis are labeled by red. Different TFs in each species are marked in different color boxes. Homologous TFs between species obtained from SAMap are connected by lines.