
IMAGE
Fig. 5
- ID
- ZDB-IMAGE-220727-5
- Genes
- Publication
- Wang et al., 2022 - Aquaporin 8ab is required in zebrafish embryonic intestine development
- All Figures
- Figures for Wang et al., 2022
Image
|
Figure Caption
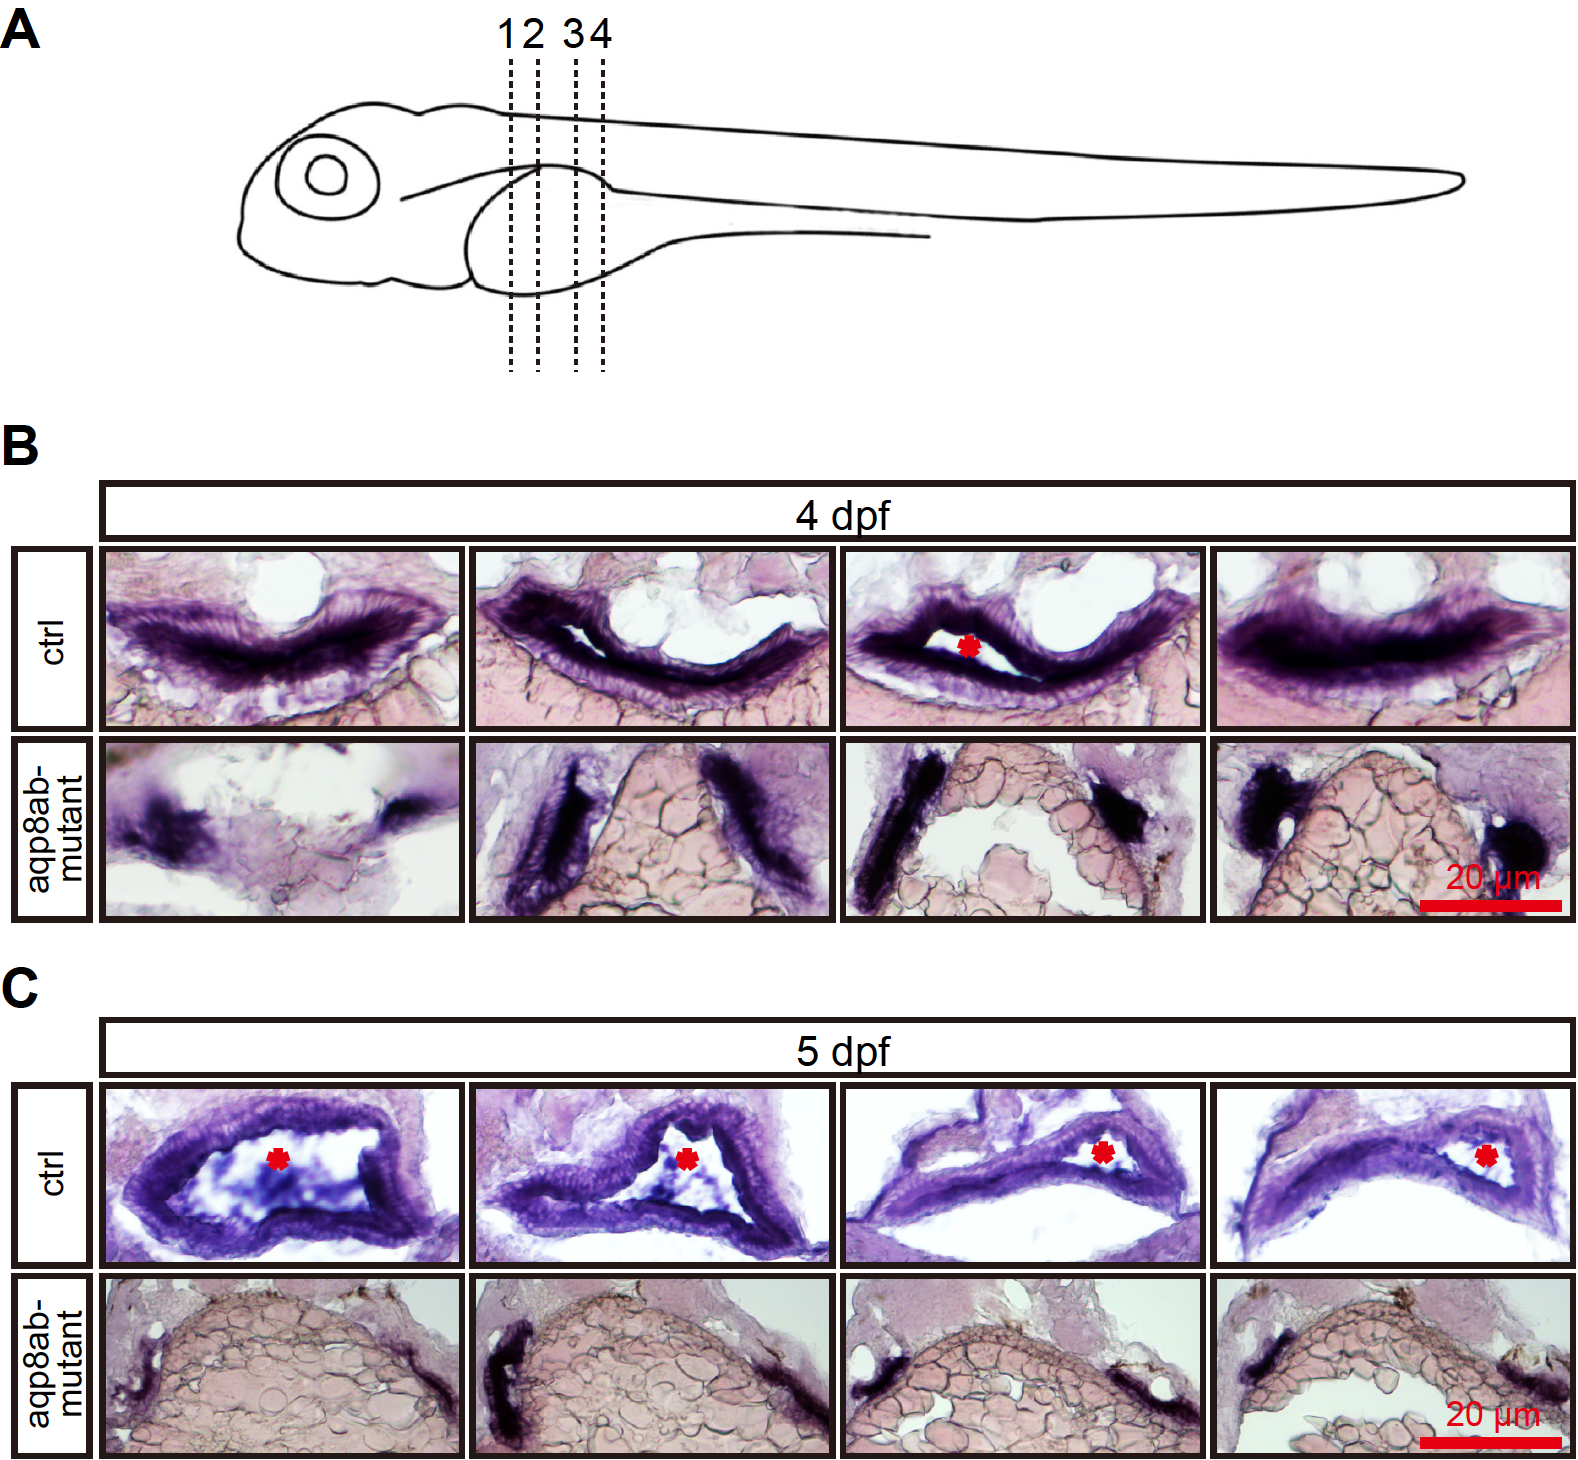
Fig. 5
(A) Schematic diagram showing transverse sections through the trunk at four different regions. (B) At 4 dpf, the control group showed a single intestinal tract, in which a lumen was already formed (stars). The
Figure Data
Acknowledgments
This image is the copyrighted work of the attributed author or publisher, and
ZFIN has permission only to display this image to its users.
Additional permissions should be obtained from the applicable author or publisher of the image.
Full text @ Acta. Biochim. Biophys. Sin (Shanghai)