
|
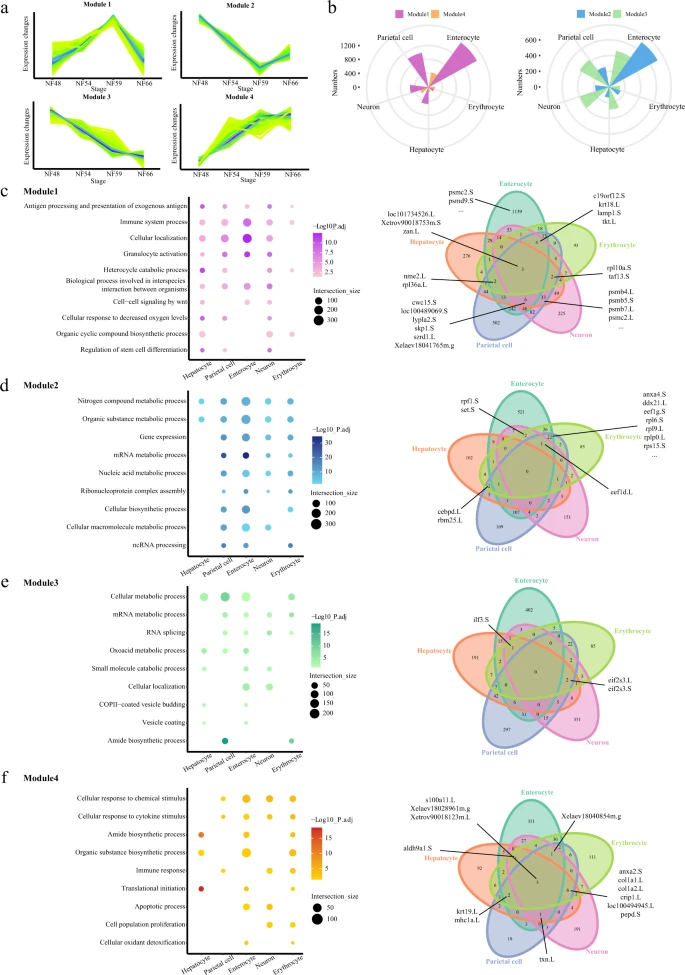
Fig. 6
a Schematic diagram of the four modules. b Rose diagrams showing the distribution of DEGs in each cell type. Different modules are labeled in different colors. c–f Representative GO terms enriched in module 1 (c), 2 (d), 3 (e), and 4 (f) for five cell types, respectively (left). GO terms enriched in different modules are labeled in different colors. Venn diagrams showing the numbers of shared genes in each module (right). The bold lines indicate the representative genes shared in at least three cell types. P value was calculated by the hypergeometric distribution, statistical test is one-sided, adjustments P values were made after P value is corrected by Benjamin–Hochberg multiple tests.