
Image
|
Figure Caption
Fig. 6
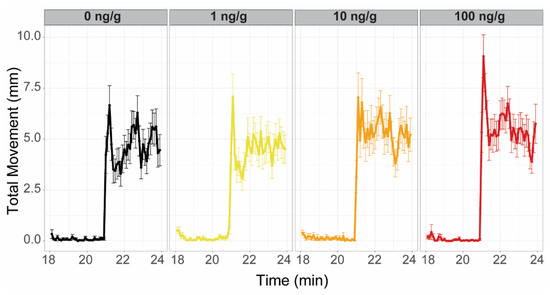
Figure 6. F1 Larval Photomotor Response. Plots represent one of the evaluated F1 zebrafish cohorts and are representative of both evaluated cohorts (120 hours post fertilization). Exposure groups are indicated on the top of each panel and by color (left to right, grey: 0 ng/g, yellow: 1 ng/g, orange: 10 ng/g, and red: 100 ng/g PFHxA added to the F0 diet). In each panel, the first 3 min were the final light period (lower total movement), while the last 3 min were the final dark period. The 10 ng/g group exhibited significant hyperactivity in the dark period relative to controls (n = 48).
Acknowledgments
This image is the copyrighted work of the attributed author or publisher, and
ZFIN has permission only to display this image to its users.
Additional permissions should be obtained from the applicable author or publisher of the image.
Full text @ Toxics