
Image
|
Figure Caption
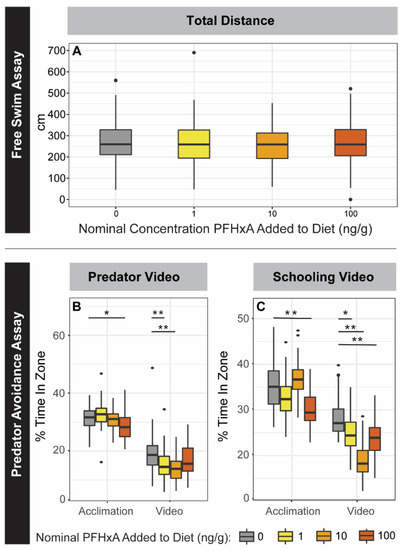
Fig. 5
Figure 5. Anxiety Behaviors for F0. F0 zebrafish were challenged with adult behavior free swim (A), predator response (B), and schooling response assays (C). Exposure groups are indicated on the x-axes and by color (left to right, grey: 0 ng/g, yellow: 1 ng/g, orange: 10 ng/g, and red: 100 ng/g PFHxA added to the diet). PFHxA juvenile dietary exposure did not affect the total distance traveled in the free swim assay (n = 66–68). The predator and schooling response plots show the percent time (cumulative duration) spent in the near zone (i.e., closest to the video display). For both predator and schooling response (n = 65–68), time spent was significantly decreased for all groups after video display (Video) compared to before (Acclimation). Significant differences between exposure groups within the Acclimation and Video periods are indicated on the plots (* p < 0.05; ** p < 0.005).
Acknowledgments
This image is the copyrighted work of the attributed author or publisher, and
ZFIN has permission only to display this image to its users.
Additional permissions should be obtained from the applicable author or publisher of the image.
Full text @ Toxics