
Image
|
Figure Caption
Fig. 3
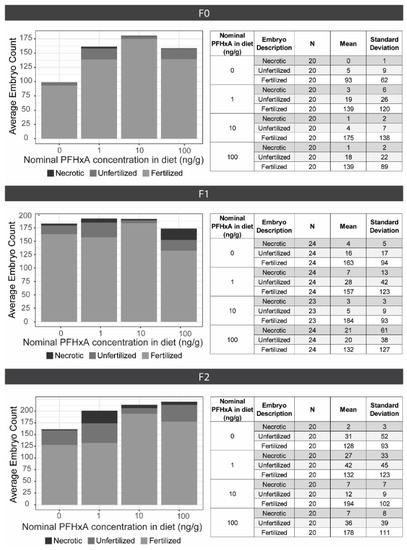
Figure 3. Fecundity Assessments. 4 groups of 3 male and 2 female zebrafish were spawned for 5–6 consecutive spawning events per generation (top: F0, middle: F1, bottom: F2). The average embryo counts are plotted on the left, including necrotic (black), unfertilized (dark grey), and fertilized (light grey) embryos for each exposure group (0, 1, 10, or 100 ng/g PFHxA added to the F0 diet). The tables on the right indicate the evaluated number of spawns (N), mean counts, and standard deviation.
Acknowledgments
This image is the copyrighted work of the attributed author or publisher, and
ZFIN has permission only to display this image to its users.
Additional permissions should be obtained from the applicable author or publisher of the image.
Full text @ Toxics