
|
FIGURE 1
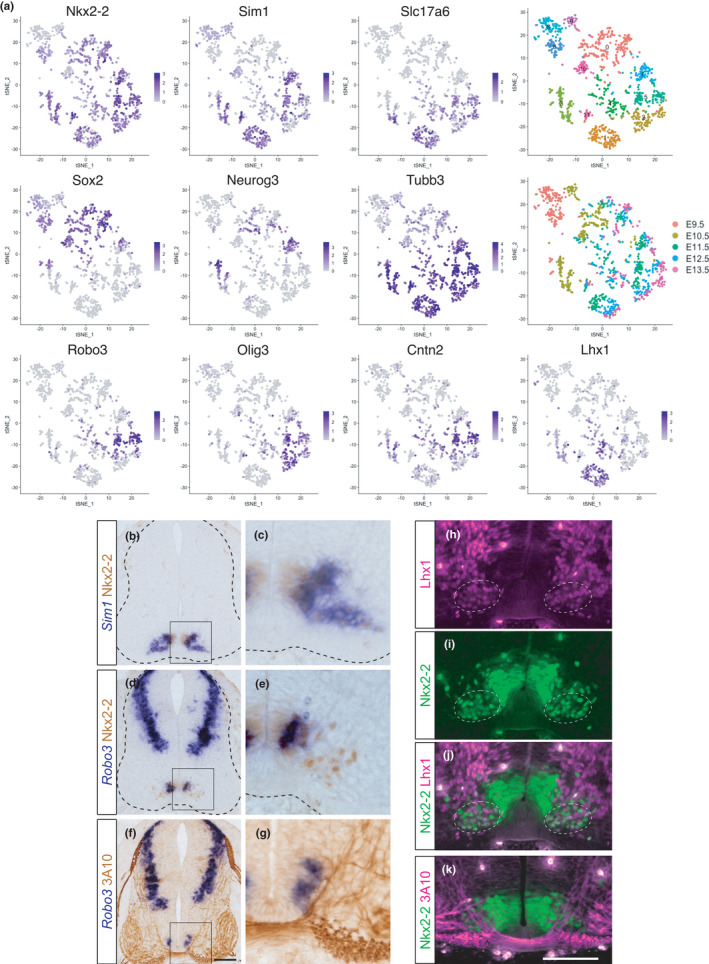
Two distinct subtypes of V3 INs in mice. (a) tSNE plot showing the cells with V3 IN identity derived from mouse embryonic spinal cords. The expression levels of the genes indicated are visualized on the tSNE plot. The top right panel shows the result of graph‐based clustering, with each cluster being colored differently. Cluster numbers (0–11) are labeled. The middle right panel shows the embryonic day when cells are corrected. (b–g) The expressions of Nkx2‐2,