
|
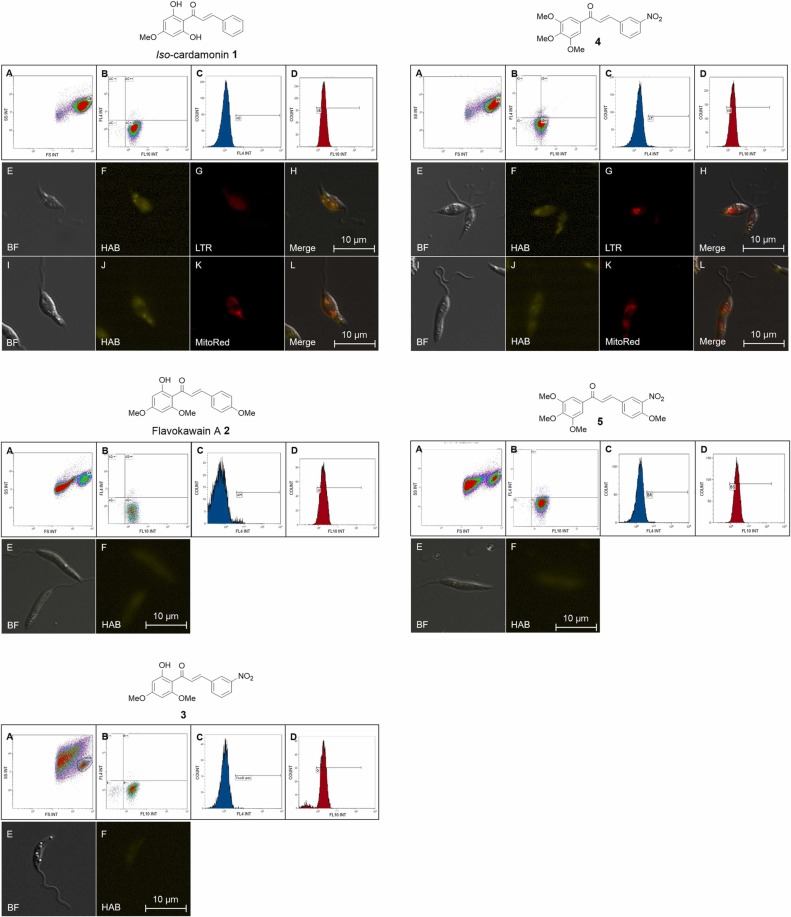
Fig. 5
Fig. 5. Cytometric quantification and microscopic fluorescence imaging of HAB (5 µM) in live L. amazonensis promastigotes (20,000 cells/µL) in presence of competitors 1-5 (100 µM). Co-markers were 7-AAD (40 µM), LTR (100 nM) or MitoRed (50 nM). A: morphological biparametric plot (FS, cell size; SS, cell granularity); B: gated plot (FL4: 7-AAD, FL10: HAB); C: 7-AAD cytometric histogram; D: HAB cytometric histogram; E and I: bright field (BF); F and J: HAB labelling; G: LTR labelling; K: MitoRed labelling, H and L: merge. IC50 values of competitors 1-5 are given in Table 1. Plot data are representative of three independent experiments. Means and standard deviations of cell count and fluorescence intensity data (n = 3) are indicated in Table 1.