
|
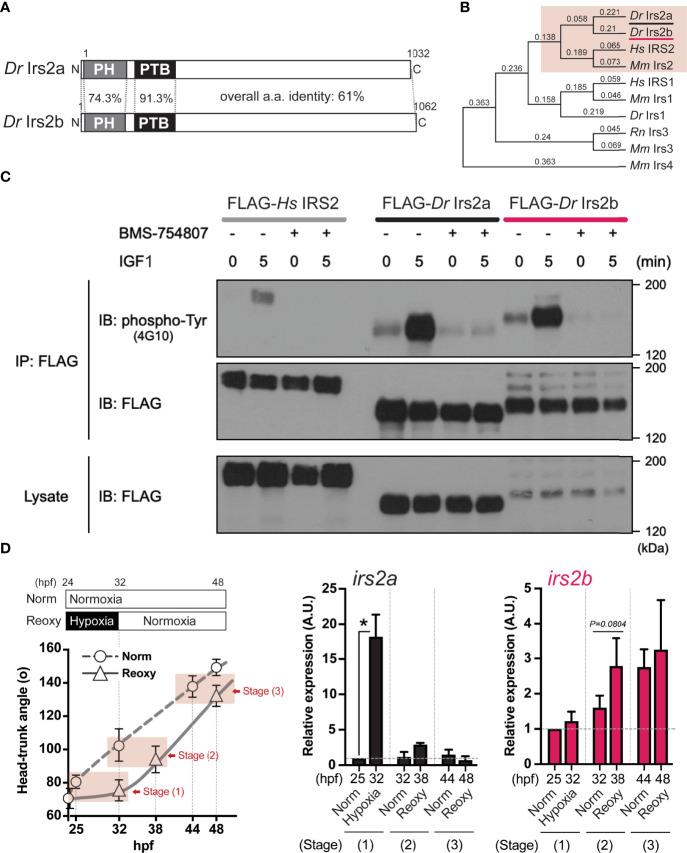
Fig. 5
Identification, characterization, and expression of two zebrafish Irs2 genes (irs2a/b). (A) Schematic illustration of zebrafish Irs2 proteins (Dr Irs2a/2b). Characteristic pleckstrin homology (PH) domain and IRS-type phospho-tyrosine binding (PTB) domain are shown. (B) Phylogenetic analysis of the deduced amino acid sequence of Irs/IRS molecules based on the Neighbor joining method with bootstrap proportions. Dr, Danio rerio; Hs, Homo sapiens; Mm, Mus musculus; Rn, Rattus norvegicus. (C) Functional assay of zebrafish Irs2s in HEK293T cells. FLAG-tagged human IRS2 and zebrafish Irs2a/b were expressed, and the cells were treated with or without the specific IR/IGF-1R tyrosine kinase inhibitor BMS-754807 and were stimulated with IGF1 (100 ng/mL) for 5 minutes. Immunoprecipitation (IP) and immunoblot (IB) analyses were performed using denoted antibodies. (D) Real-time Q-PCR analysis of irs2a/b expression during zebrafish embryogenesis. Data are average ± SD, n=8-38. The sampling timing and the outline of experimental design are shown in the left. Embryos harboring statistically comparable body size was applied for the gene expression comparison: stage (1), 25 hpf Norm vs 32 hpf Hypo; stage (2) 32 hpf Norm vs 38 hpf Reoxy; stage (3), 44 hpf Norm vs 48 hpf Reoxy. Total RNA originating from whole embryos was used for cDNA synthesis, and the house-keeping gene (β-actin) expression was used for the internal control and normalization. The data are shown as ± SE of 3 independent assays. The Norm 25 hpf group is set as 1.0. The asterisk (*) denotes statistical difference at P<0.05.