
|
Fig. 2
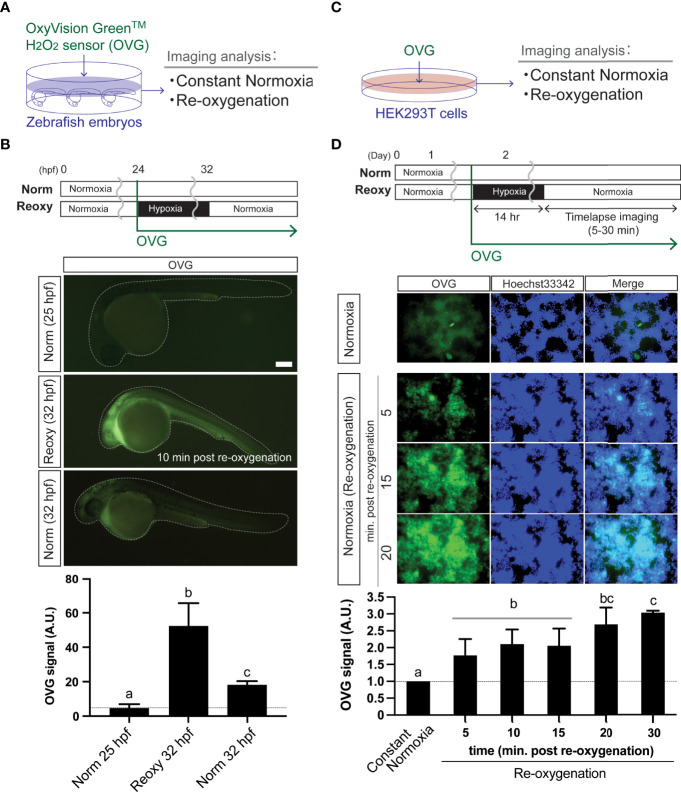
Re-oxygenation increases H2O2 generation in the zebrafish embryo and mammalian cells. (A) Experiment summary. The zebrafish embryos exposed with a specific H2O2 sensor probe (OxyVision Green™: OVG) were placed in distinct environments (constant normoxia: Norm and re-oxygenation: Reoxy) and subjected to imaging analysis. (B) The 24 hpf zebrafish embryos were exposed to hypoxia with 10 μM of OVG for 8 hr. Then, the fluorescence intensity at around 10 minutes after re-oxygenation was measured. The stage-matched (25 hpf Norm) and the chronological age-matched (32 hpf Norm) embryos were also tested for comparison. Bar, 100 μm. The OVG signal was calculated relative to the signal intensity of the 25 hpf Norm embryos. Data are mean ± SE of 5 independent experiments. The different letter denotes statistical significance at P<0.05. (C) Experiment summary. The human embryonic kidney cells (HEK293T cells) exposed with OVG were placed in Norm or Reoxy condition and subjected to imaging analysis. (D) The cells were exposed to 14 hr-long hypoxia with 5 μM of OVG. The OVG signal was calculated relative to the signal intensity of the Norm cells. Data are mean ± SE of 4-5 independent experiments. Values marked with different letters (a, b, c) are significantly different from each other (P<0.05), but values marked with common letters (b and bc; bc and c) are not significantly different from each other (P>0.05).