
IMAGE
Fig. 6
- ID
- ZDB-IMAGE-220720-114
- Publication
- Moran et al., 2022 - Dawn and dusk peaks of outer segment phagocytosis, and visual cycle function require Rab28
- All Figures
- Figures for Moran et al., 2022
Image
|
Figure Caption
Fig. 6
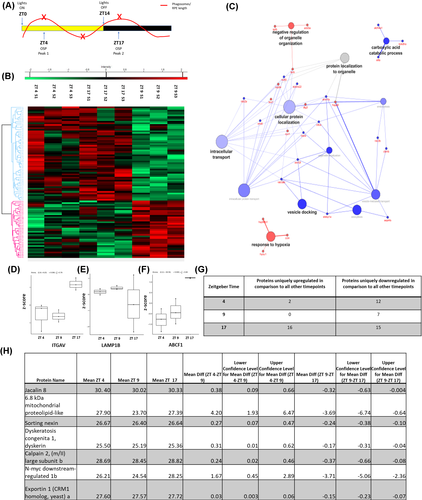
Investigation into internal regulators of zebrafish outer segment phagocytosis (OSP). (A) Time course highlighting sample collection time (red x) in relation to phagosome-level fluctuation (B) Heat map representing differentially expressed proteins between 2 months post fertilization wild-type siblings at ZT 4, ZT 9, and ZT 17, respectively, illustrating proteins significantly upregulated (in red) or downregulated (in green), given a cut-off of −log p-value ≥1.3. Student's t test was used for statistical analysis. (C) Gene ontology analysis of significantly downregulated and upregulated proteins at OSP peaks (ZT 4 and ZT 17 grouped) compared with an OSP trough (ZT 9). (D–F) Box and whisker plots showing the normalized expression profile of known OSP-associated proteins Itgav, Lamp1b, and Abcf1 at ZT 4, ZT 9, and ZT 17. (G) Table containing the number of proteins that are specifically upregulated or downregulated at ZT 4, ZT 17, or ZT 9. (H) Table documenting the mean of the seven proteins specifically downregulated at the OSP trough (ZT 9) compared with OSP peaks (ZT 4 and ZT-17); the difference in the mean and the upper and lower confidence intervals for ZT 4 relative to ZT 9 or ZT 9 relative to ZT 17.
Acknowledgments
This image is the copyrighted work of the attributed author or publisher, and
ZFIN has permission only to display this image to its users.
Additional permissions should be obtained from the applicable author or publisher of the image.
Full text @ FASEB J.