
IMAGE
Fig. 2
- ID
- ZDB-IMAGE-220720-110
- Publication
- Moran et al., 2022 - Dawn and dusk peaks of outer segment phagocytosis, and visual cycle function require Rab28
- All Figures
- Figures for Moran et al., 2022
Image
|
Figure Caption
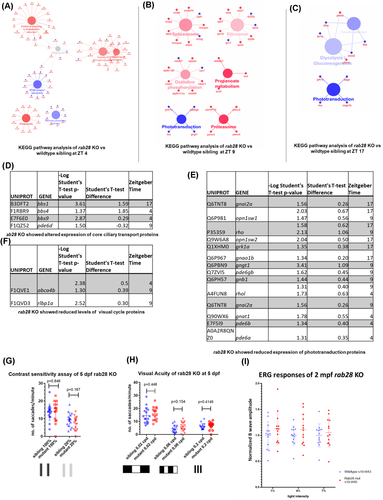
Fig. 2
Pathway analysis of the altered protein profile of rab28 KO shows reduced levels of core ciliary trafficking and phototransduction components (A–C) KEGG pathway analysis of significantly downregulated (blue) and upregulated (red) proteins in rab28−/− compared with wild-type siblings at outer segment phagocytosis peaks and trough (D–F) Tables describing significantly downregulated and upregulated proteins associated with core ciliary trafficking components (D), phototransduction (E) and the visual cycle (F), respectively. Statistical analysis was carried out using a student's t test. (G) Scatter plot of visual behavior-based contrast sensitivity of rab28−/− larvae at 5 days post fertilization (dpf). Data are from three independent replicates. At least 16 larvae were tested per genotype for each assay. (H) Scatter plot of visual behavior-based visual acuity of rab28−/− larvae at 5 dpf. rab28 KO larvae do not show any reduction in visual acuity compared with sibling control when tested at 0.02, 0.06 or 0.2 cpd, analyzed using a student's t test. Data are from three independent replicates, analyzed using a student's t test. (I) Normalized ERG b-wave amplitudes recorded in rab28 KO at 2 months post fertilization show no significant difference compared with ERG-traces from wild-type controls (n = 12, n = 13), statistical analysis was carried out using a student's t test
Figure Data
Acknowledgments
This image is the copyrighted work of the attributed author or publisher, and
ZFIN has permission only to display this image to its users.
Additional permissions should be obtained from the applicable author or publisher of the image.
Full text @ FASEB J.