Fig. 5
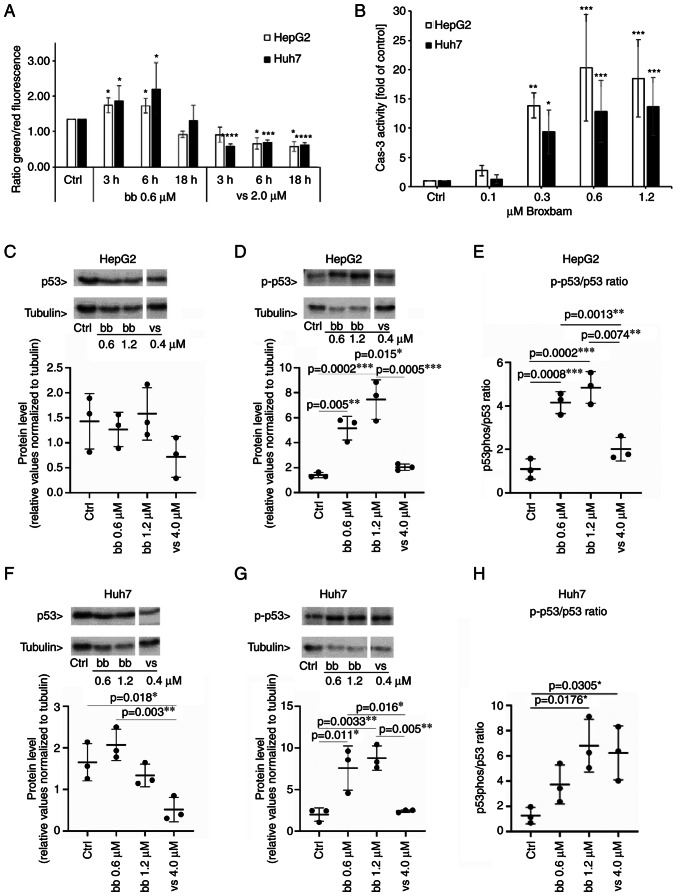
Detection of proapoptotic events in liver cancer cells. (A) Influence of bb and vs on the loss of mitochondrial membrane potential of liver cancer cell lines HepG2 and Huh7. Indicated values were measured by fluorometric measurement of JC-1-stained cells. The effect of IC50 concentrations of bb and vs was monitored after 3, 6 and 18 h. Mitochondrial accumulation of JC-1 results in red fluorescence whereas loss of MMP results in monomeric JC-1, which emits green fluorescence. Data are presented as the ratio of green/red fluorescence of cells. Data are presented as the mean ± SEM from three experiments. One-way ANOVA with Tukey's post hoc test was used to test for significance. *P<0.05, ***P<0.001 and ****P<0.0001 vs. Ctrl. (B) Caspase-3 activity in HepG2and Huh7 cells upon treatment with bb for 24 h. Data are presented as the mean ± SEM percentage of untreated controls from four experiments. One-way ANOVA with Tukey's post hoc test was used to test for significance. *P<0.05, **P<0.01 and ***P<0.001 vs. ctrl. (C-H) HepG2 and Huh7 cells were treated either with solvent (Ctrl), bb at IC50 (0.6 µM), bb at two-fold IC50 (1.2 µM) or vs. at two-fold IC50 (4.0 µM). Western blotting results of (C) p53 expression and (D) phosphorylation levels in HepG2 cells. (E) p-p53/p53 ratio was also quantified in HepG2 cells. Western blotting results of (F) p53 expression and (G) phosphorylation levels in Huh7 cells. (H) p-p53/p53 ratio was also quantified in Huh7 cells. Corresponding representative western blotting images are shown in Fig. S2. n=3 per group. One-way ANOVA with Tukey's post hoc test was used to test for significance. Bb, broxbam; vs, vorinostat; Ctrl, control; Cas 3, caspase 3; p-, phosphorylated.

