
Image
|
Figure Caption
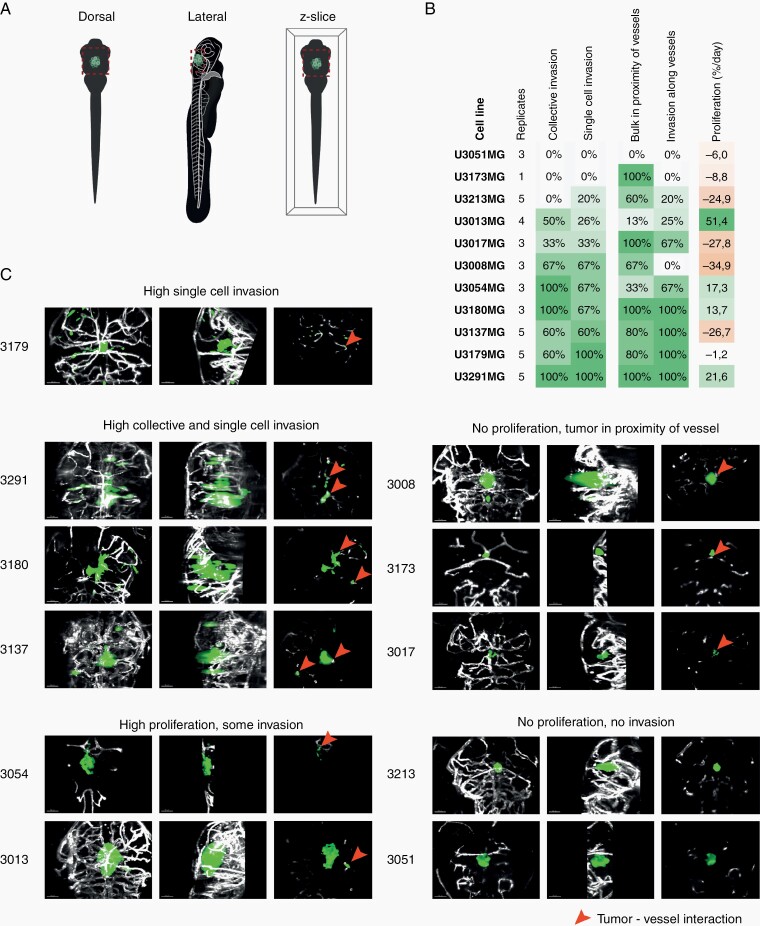
Fig. 4
Patient-derived glioblastoma cells (PDC) show heterogenous growth and invasion patterns. (A) Illustration of images in (C). (B) Quantified in vivo characteristics for 11 PDCs. (C) Representative light-sheet (maximum projection) images of the different growth patterns for 11 PDCs in live zebrafish at 5dpf. Left: dorsal; middle: lateral; right: z-slice. Green = GFP, white = mCherry. Scale bars = 50 um.
Acknowledgments
This image is the copyrighted work of the attributed author or publisher, and
ZFIN has permission only to display this image to its users.
Additional permissions should be obtained from the applicable author or publisher of the image.
Full text @ Neuro Oncol.